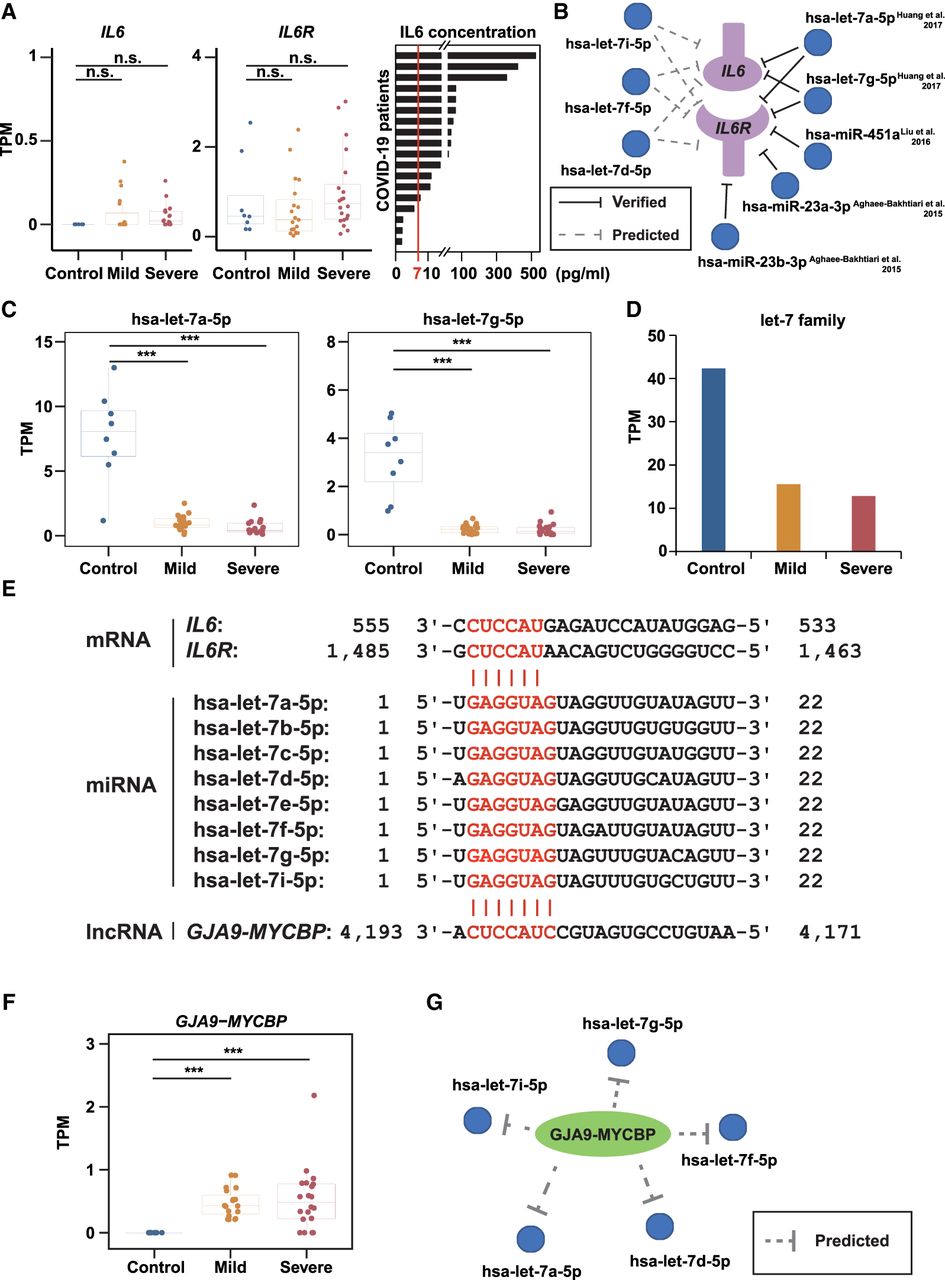
Noncoding regulatory RNA responses of COVID-19 patients to SARS-CoV-2 infection. (A) The mRNA expression levels (TPMs) of IL6 (left) and IL6R (middle), and the protein levels of IL6 (right) in COVID-19 patients’ plasma. The red line indicates the normal range of IL6 (0–7 pg/mL). (B) Predicted (left, dashed lines) and experimentally validated (right, solid lines) miRNA-target interactions. (C) Box plot showing the expression levels of hsa-let-7a-5p and hsa-let-7g-5p. (D) Bar plot showing the summation of the entire let-7 family expression levels. (E) Base-pairing interaction between let-7 family and IL6/IL6R (top) or GJA9-MYCBP (bottom). Target sites and seed sequences are highlighted in red. (F) Box plot showing the expression levels of GJA9-MYCBP. (G) Putative regulatory network of GJA9-MYCBP and let-7 family. Asterisks indicate statistically significant differences; (***) P < 0.001, (n.s.) not significant.