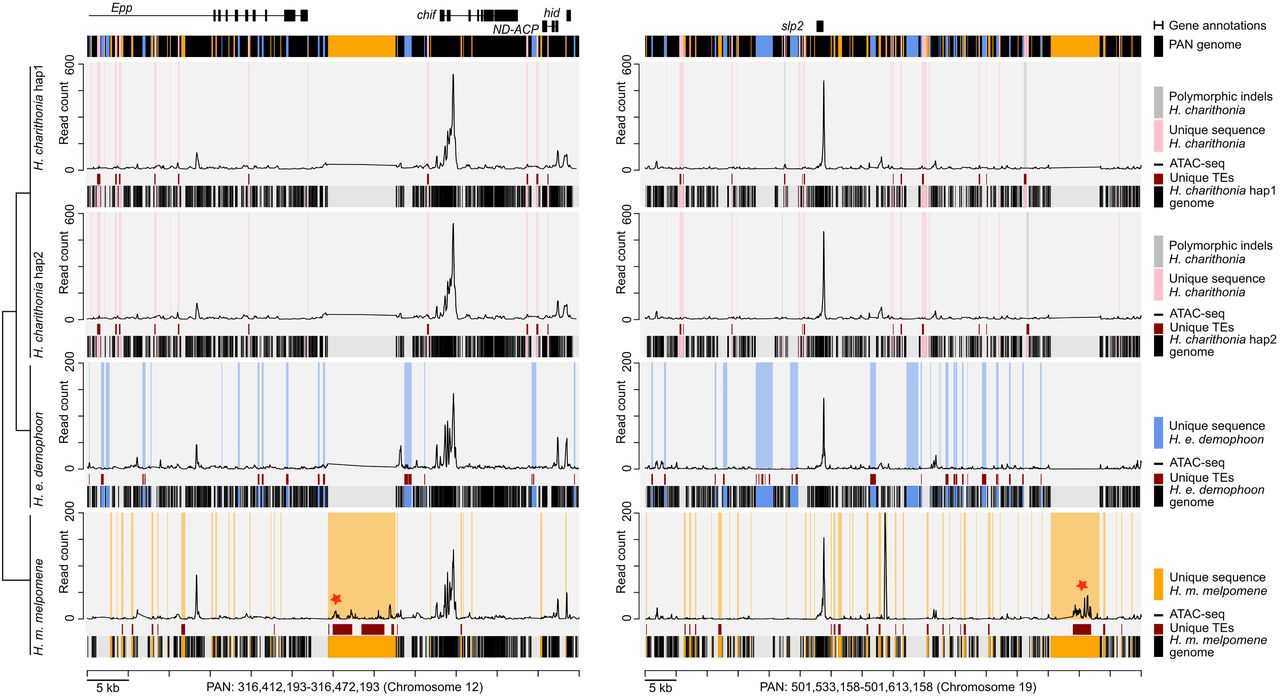
Example intervals of the pan-genome assembly of H. charithonia (pink), H. erato (blue), and H. melpomene (orange) with alignment of lineage-specific genome sequences, transposable element (TE) annotations, and ATAC-seq profiles in the pan-genome coordinate space. The plots show an illustrative interval of the pan-genome assembly near the gene chiffon (chif) and sloppy paired 2 (slp2) that highlights sequences present in each of the genomes relative to the pan-genome (black shading underneath each of the graphs), lineage-specific sequences in each of the genomes (pink, blue, and orange shading in graphs), TEs that overlap with lineage-specific sequences (dark red), and ATAC-seq profiles for head tissue (average of two biological replicates). Gray shading in the H. charithonia haplotype 2 (hap2) graph indicates an indel in the genome of a single H. charithonia individual. Red stars indicate ATAC-seq peaks with head-specific accessibility (compared with wing tissue) that intersect with a lineage-specific TE insertion. See Supplemental Figure S7 for additional examples of intervals around tropomodulin (tmod) and Mitofilin (Mitofilin). The Supplemental Material provides code to reproduce similar plots for any region in the pan-genome.