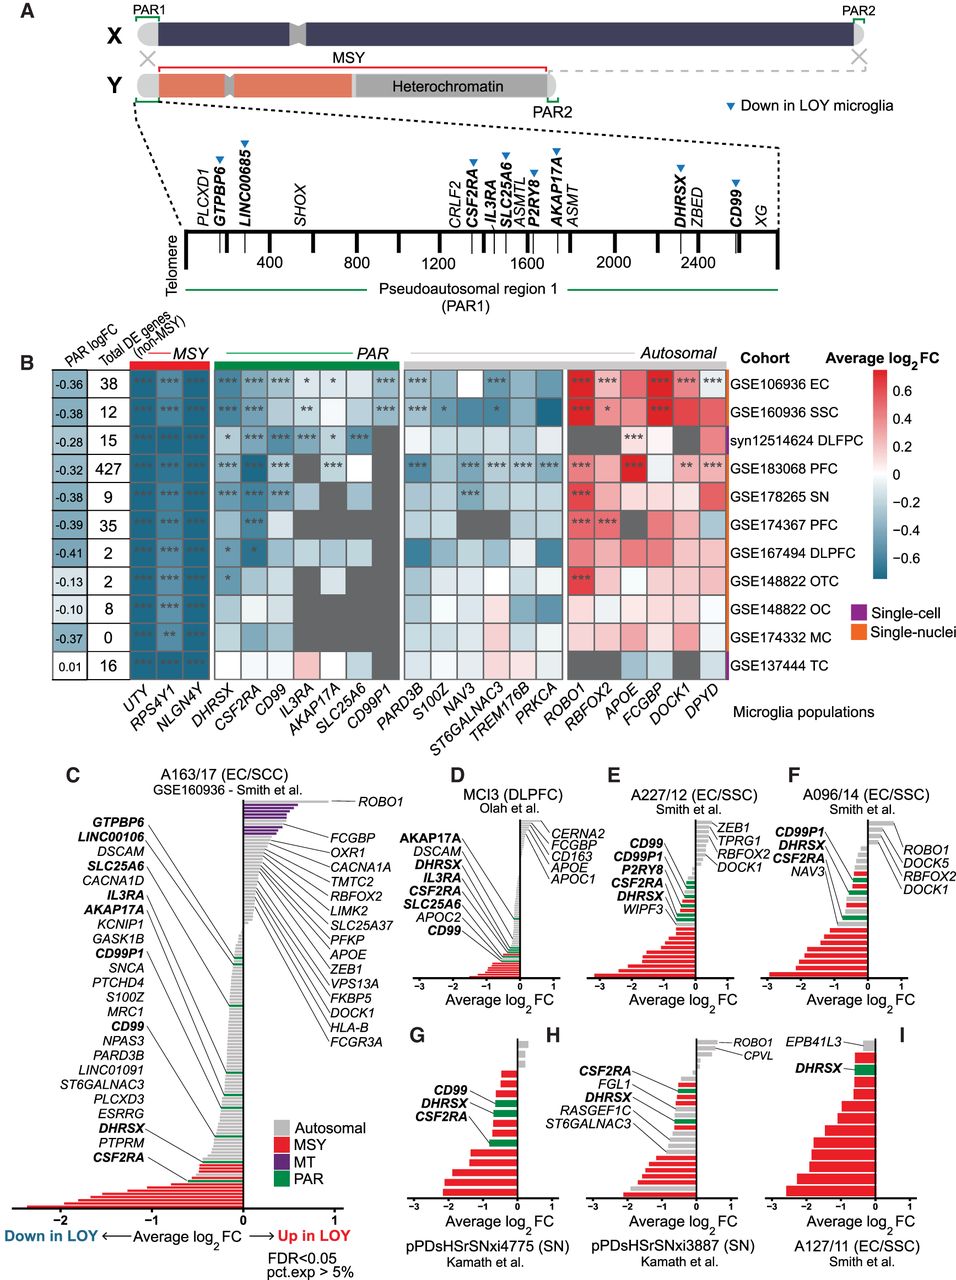
Decreased PAR gene expression is common in LOY microglial populations. (A) Schematic of the human sex chromosomes and pseudoautosomal regions (PARs). The PARs are homologous sequences shared between Chromosomes X and Y. Blue triangles indicate PAR genes with significant expression reduction in at least one donor microglia LOY population (FDR < 0.05). (B) Heatmap of microglia DE genes across several single-cell/nuclei cohorts with at least 100 LOY cells/nuclei (average logFC). If multiple brain regions were sampled within a given data set, they were split by brain region and labeled accordingly. The total number of significant, non-MSY DE genes (P < 0.1) detected per data set is provided on the left. The second column displays cumulative logFC of all expressed PAR genes. Rows are colored based on source of nucleic acid (whole cell or nuclei). Bonferroni significance is provided within each cell: (*) P < 0.1, (**) P < 0.01, (***) P < 0.001. (C–I) Average log fold change (logFC) of DE genes between LOY and non-LOY cells/nuclei within microglia from seven subjects, including the following: (C) A163/17 (AD; GSE160936); (D) MCI3 (MCI; syn12514624); (E) A277/12 (AD; GSE160936); (F) A096/14 (AD; GSE160936); (G) pPDsHSrSNxi4775 (PD; GSE178265); (H) pPDsHSrSNxi3887 (PD; GSE178265); and (I) A127/11 (control; GSE160936) (more than 2000 UMI and more than 1000 nGene; FDR < 0.05).