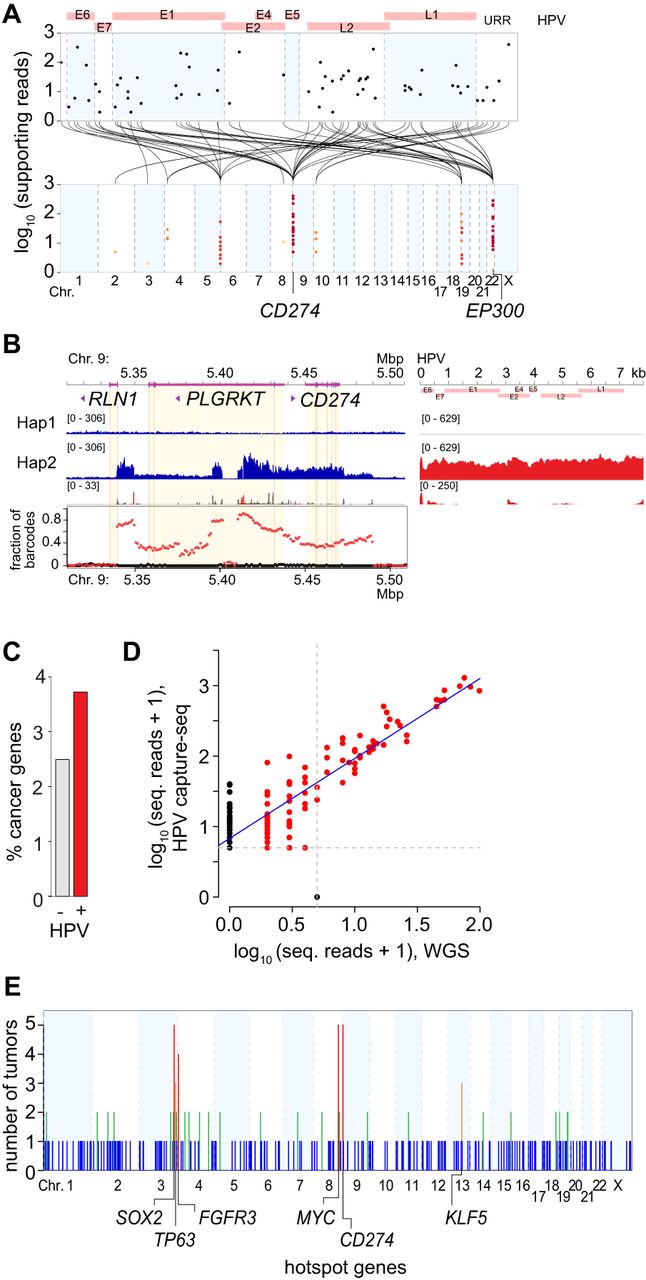
Associations between HPV integrants, CNVs, and SVs in individual tumors. (A) Strudel plot shows virus–host breakpoints in a representative OPSCC, GS18047. Breakpoints mapped to the HPV16 genome (top, x-axis) are connected (black lines) with the host genome (bottom, x-axis), clustered on Chr 4, 5, 9, 10, 19, and 22 (colored dots, as per key in Fig. 1C). Disrupted genes include CD274 and EP300. (B) Haplotype-resolved linked reads (blue, host depths of sequencing coverage; red, HPV) connect HPV16 sequences (right), virus–host breakpoints (red peaks) and host–host breakpoints (gray) on one allele (haplotype 2) at the CD274 locus on Chr 9p24.1. Graph (bottom), shared linked-read barcodes connect HPV16 exclusively to haplotype 2 (red) but not haplotype 1 (black). (C) Fraction of genes with (red) or without (gray) HPV breakpoints within ±500 kb that are annotated cancer genes (y-axis) (Sondka et al. 2018). Fisher's exact test, P = 6.3 × 10⁻⁵ (Supplemental Table S3.2). (D) Scatterplot shows strong correlation between read counts supporting individual breakpoints (red dots) identified with HPV capture-seq (y-axis, n = 164) versus WGS (x-axis, n = 86) in the same tumor (r = 0.91; P = 1.8 × 10−63). (E) Adding 53 tumors studied by HPV capture-seq to 105 tumors studied by WGS (Fig. 1A), tumors harboring ≥1 virus–host breakpoints (y-axis) in 1-Mbp genomic segments were recounted across the human genome (x-axis). Statistically significant, recurrent hotspots (orange, n = 3 tumors; red, n = 4 or 5) are detected at segments containing SOX2, TP63, FGFR3, MYC, CD274, and KLF5 (empirical probability, P = 7 × 10⁻⁶). See also Figure 2, Supplemental Figures S3.1–S3.3, and Supplemental Tables S3.1–S3.7.