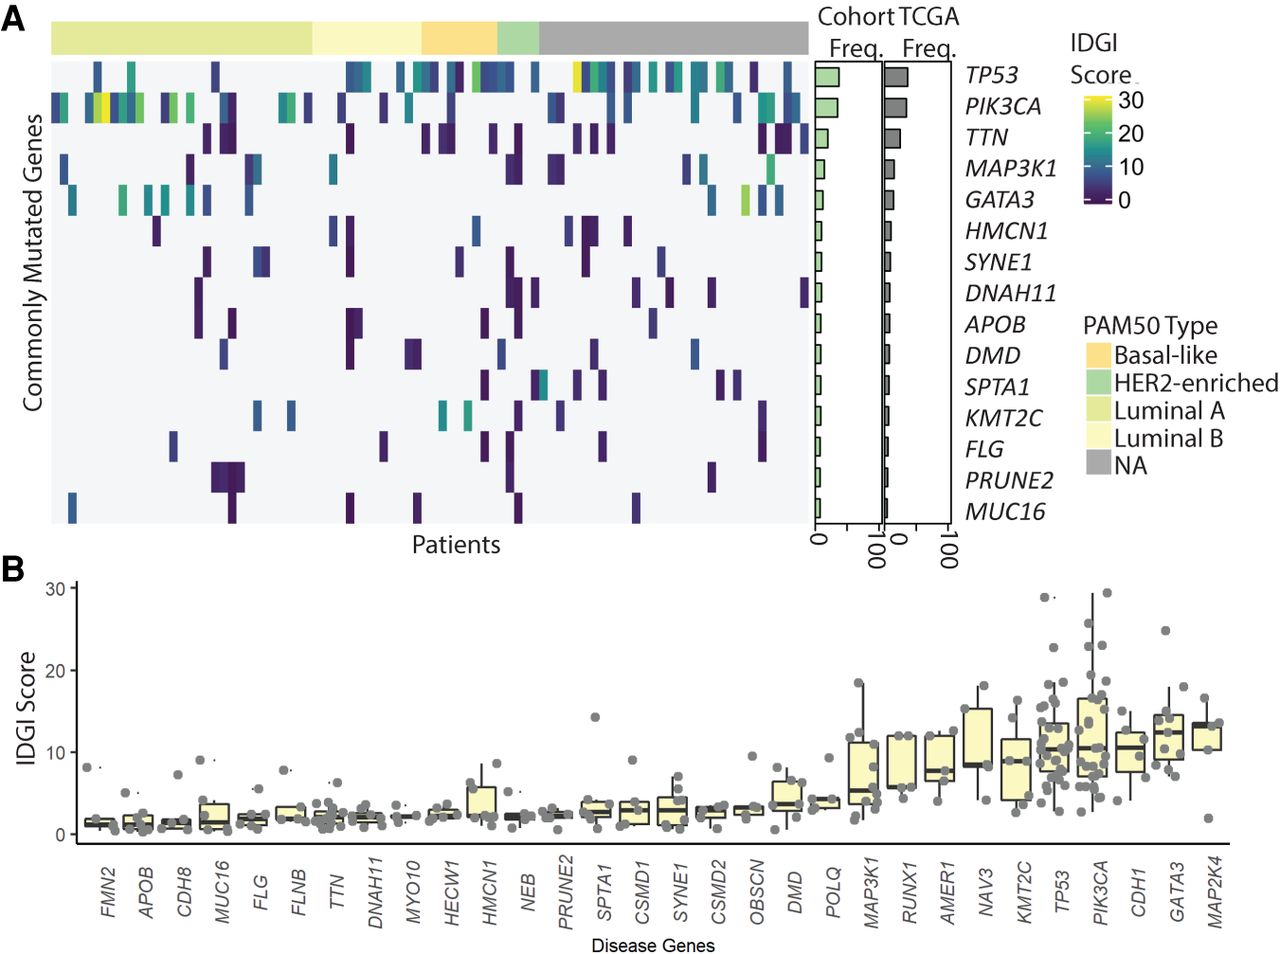
Figure 4.
Heterogeneity of disease gene importance across patients and disease genes. (A) Heatmap showing the IDGI scores for the most commonly mutated genes. Side histograms show the percentage of patients with that gene mutated in our cohort (green) and the TCGA-BRCA project as a whole (gray). (B) Boxplots for IDGI scores by most commonly mutated genes.