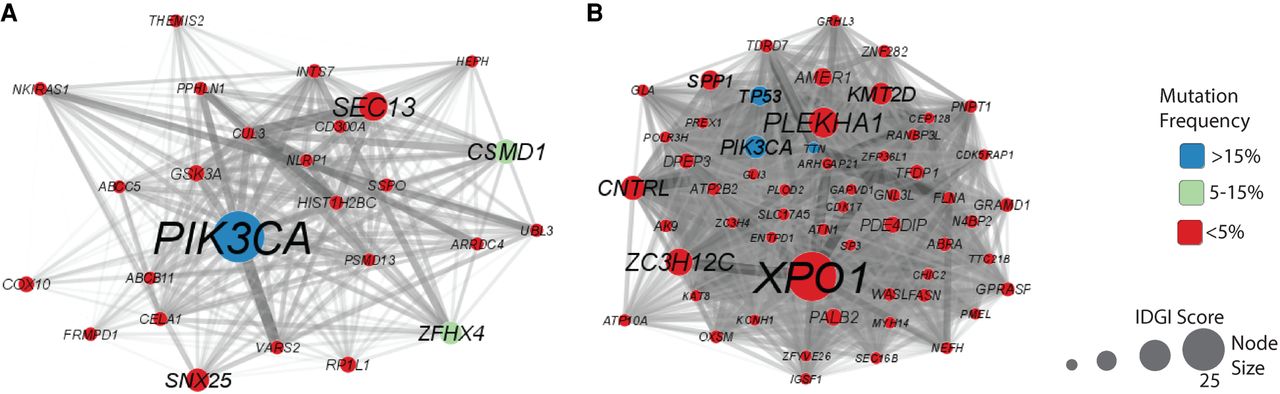
Figure 3.
Individualized disease modules displaying varied gene importance in two representative patients. (A,B) Individualized disease modules for two representative patients. Edge color intensity is determined by the distance between the mutated genes. Node size corresponds to IDGI score, and node color reflects mutation frequency within the entire TCGA BRCA cohort.