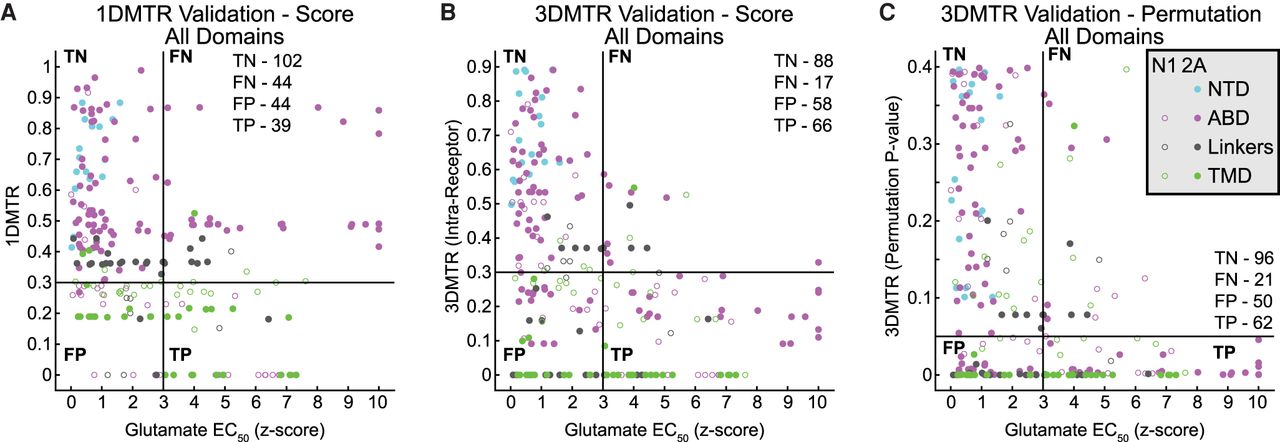
The 3DMTR is a better predictor of functional consequences of GRIN1/2A point mutations. (A–C) Scatter plots of various residues’ glutamate EC50 (represented as a Z-score based on intra-study wild-type distribution) and MTR score: (A) 1DMTR; (B) 3DMTR; (C) 3DMTR permutation analysis. Thresholds for the MTR score, <0.3 (A), <0.3 (B), <0.05 (C), and for the glutamate EC50 Z-score (>3) were determined from the distribution of WT EC50 values across the studies included. Implementation of threshold criteria creates a binary classification to determine the portions of the residues which are deemed highly intolerant and have differences in receptor function when mutated. Thus, each residue can be classified as true negative (TN), false negative (FN), false positive (FP), and true positive (TP), and the various MTR methods can be compared.