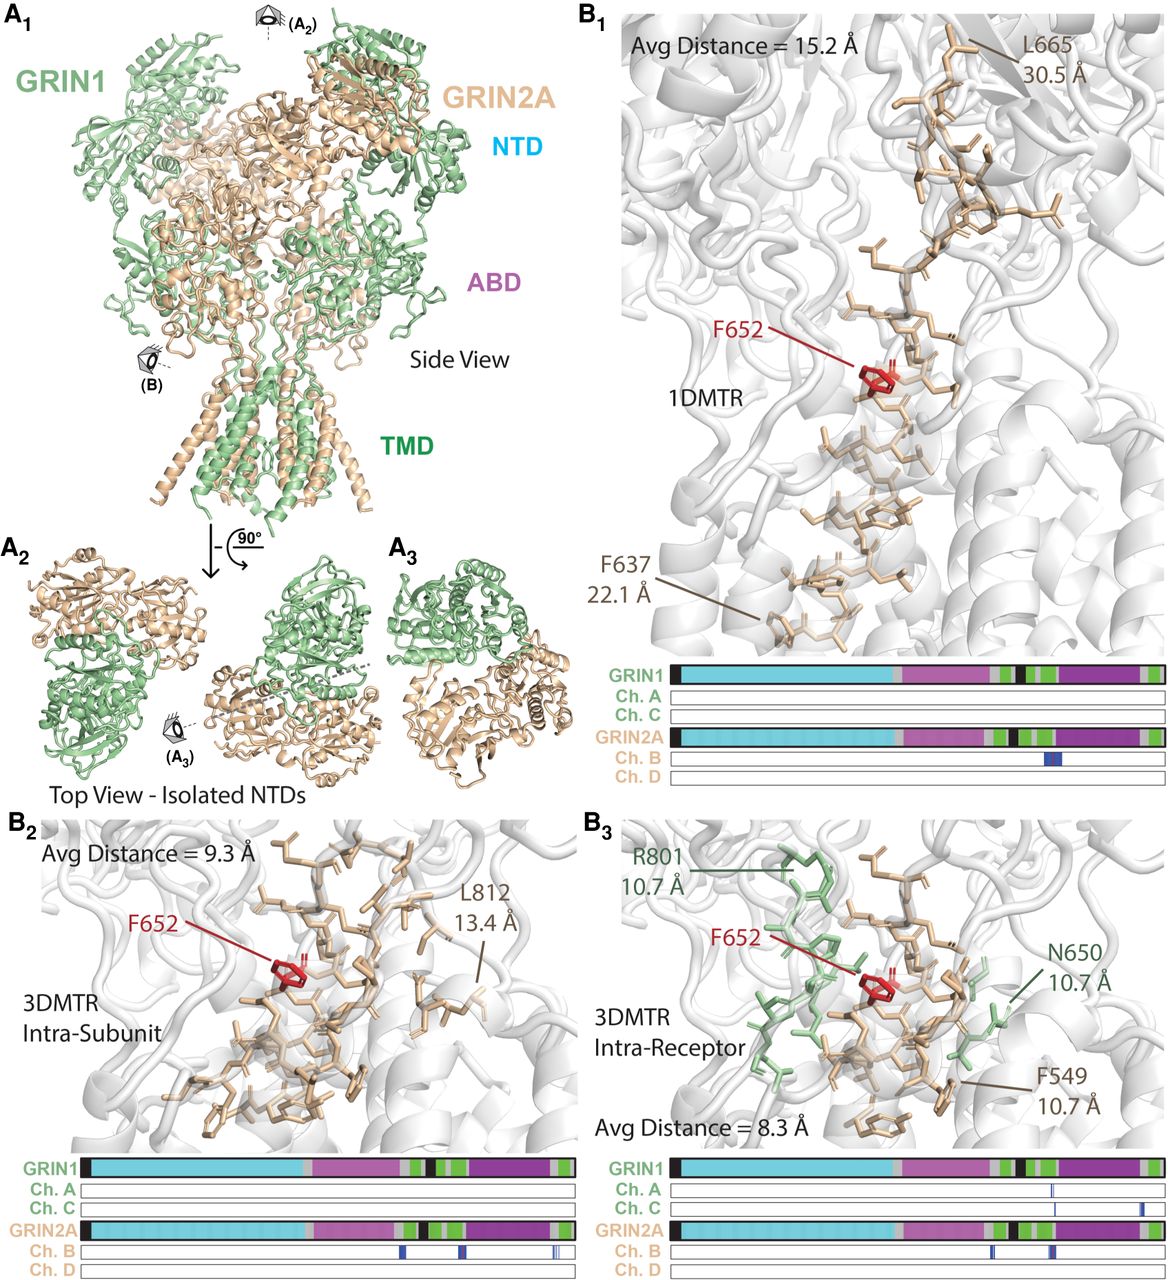
Comparison of the included residues in the 1DMTR, 3DMTR intra-subunit, and 3DMTR intra-receptor calculation. (A) Structural views of the GRIN1/2A receptor. The GRIN1 subunits are colored in pale yellow and the GRIN2A subunits are colored pale green. The full receptor is shown in A1, a top down view of the four isolated NTDs of the receptor in A2, and a side view of one NTD dimer in A3. B) The closest 31 residues as determined using the 1D polypeptide sequence (B1), the inter-residue distances within just the GRIN2A subunit (B2), and the inter-residue distances within the GRIN1/2A receptor structure (B3). This viewpoint is depicted by the cartoon eye labeled (B) in A1. Of the closest 31 residues in the receptor structure to GRIN2A-Chain B-Phe652, there are three residues from Chain A, nine residues from Chain C, and 19 residues from Chain B. A view of the receptor structure and a raster plot of the closest residues are shown. In the structure views, the closest 31 residue side chains are depicted by sticks and colored based on the subunit coloring in A: (yellow) GRIN1; (green) GRIN2; (red) Phe652.