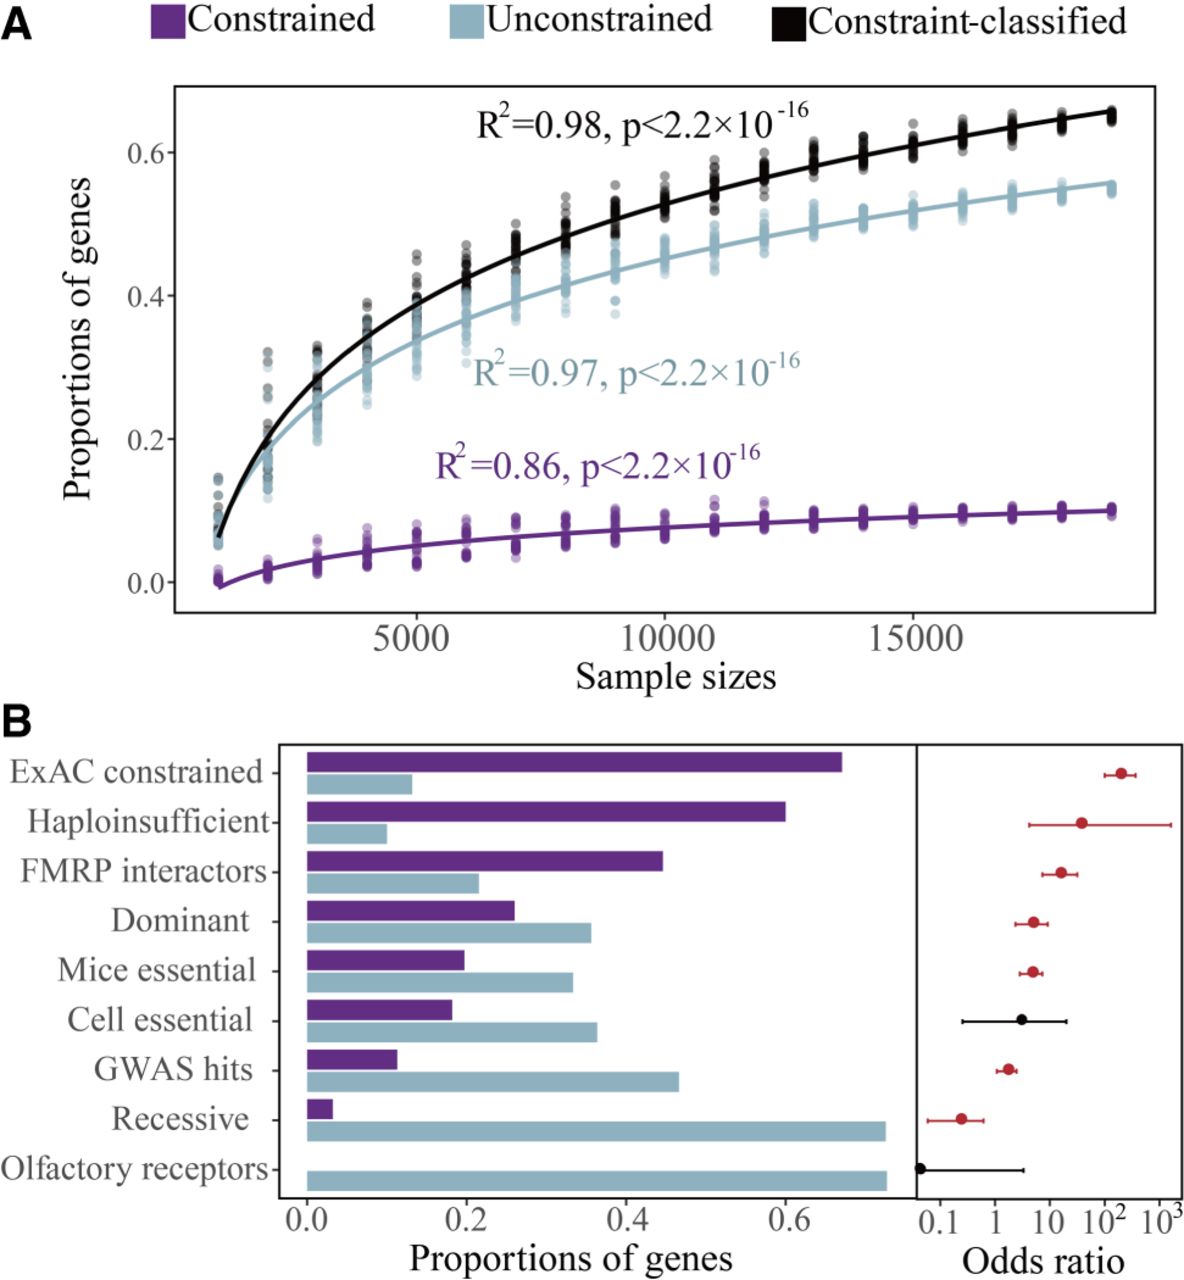
Figure 3.
Gene constraint of PTVs. (A) Increased proportions of constrained (pLI ≥ 0.9), unconstrained (pLI ≤ 0.1), and constraint-classified (pLI ≥ 0.9 or pLI ≤ 0.1) genes with greater sample sizes. (B) (Left) Proportions of constrained versus unconstrained genes of 19,973 Chinese across gene sets. (Right) Enrichment or depletion of constrained genes in the gene sets of interest. P-values and odds ratios with 95% confidence intervals were calculated via two-sided Fisher's exact tests. The dots and lines would appear in red if P < 0.05, otherwise in black. Detailed information is shown in Supplemental Table S8.