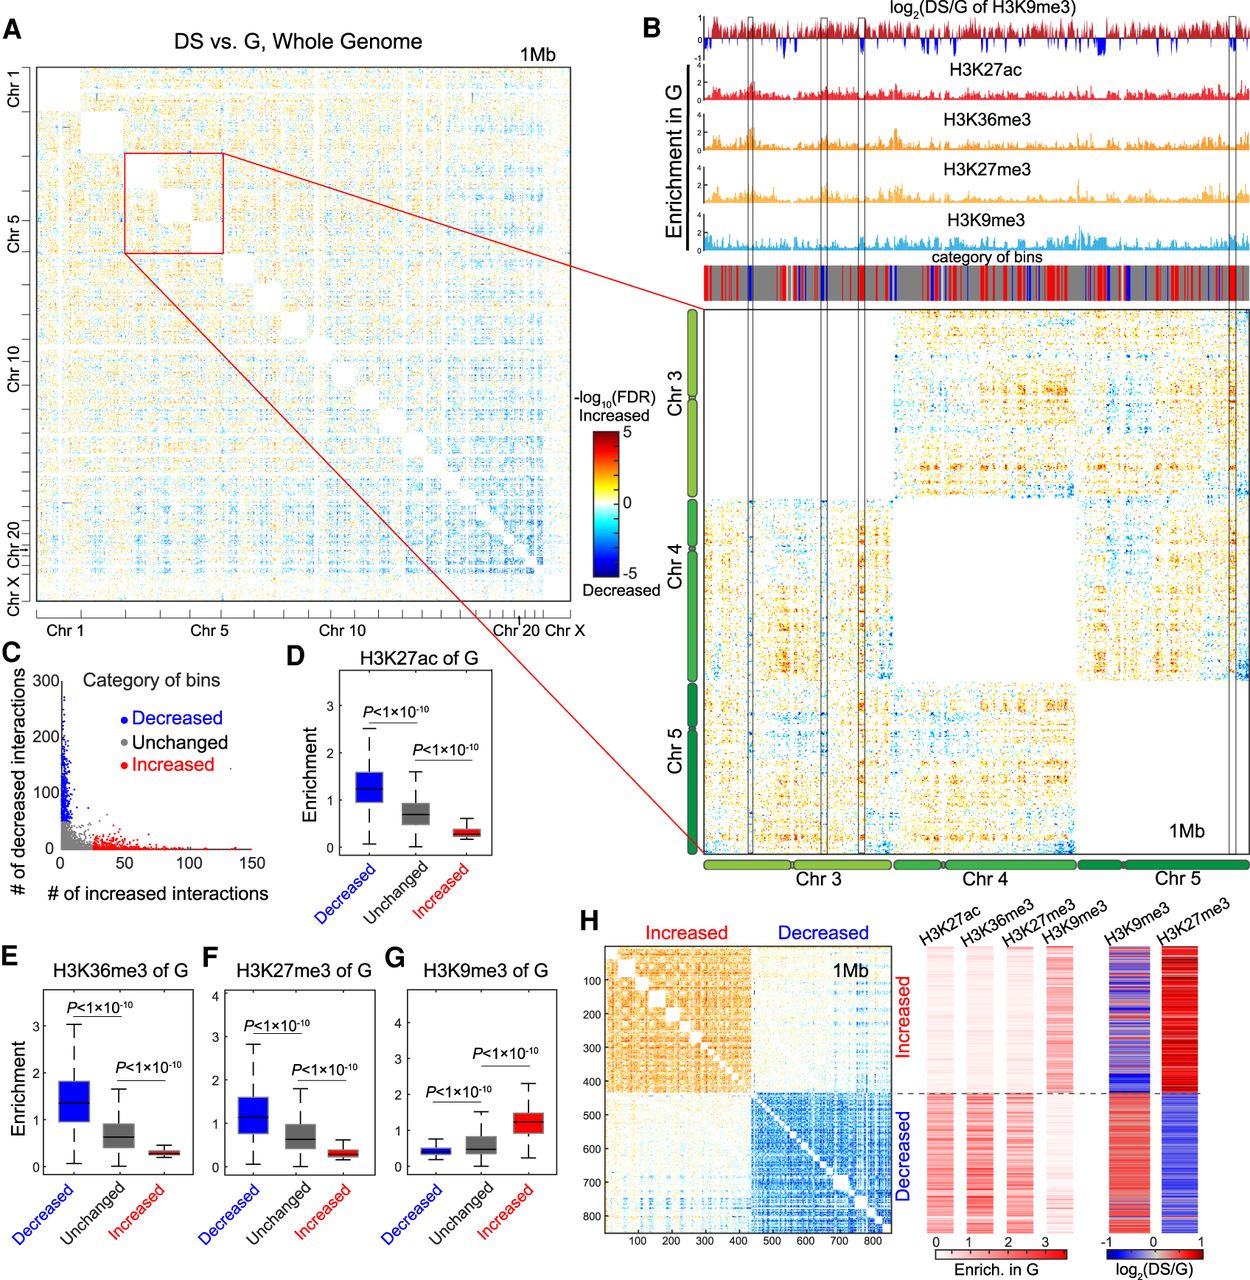
Differential interchromosome interactions. (A) Differential interactions of interchromosome between DS versus G. Intrachromosome interactions were removed before calculating differential interchromosome interactions. Colors represent −log10(FDR); red represents increased interactions, blue denotes decreased interactions. The unbalanced distribution of decreased and increased interactions in large and small chromosomes might be due to the differences of gene density and chromosome length for different chromosomes. Small chromosomes interact more frequently with each other than other chromosomes in G, and these interactions globally decrease during senescence, which was also verified by direct subtraction of contact maps (Supplemental Fig. S11). (B) Zoomed-in view of the interchromosome interactions of Chr 3, Chr 4, and Chr 5. Regions within boxes are examples of genomic regions harboring consistent decreased or increased interactions. Histone modification tracks of G, fold changes of H3K9me3 between DS and G, and bin categories were added to the top of heatmap. Increased-interaction bins were enriched for H3K9me3 of G and associated with loss of H3K9me3 in DS. (C) Scatterplot of the numbers of increased interactions and decreased interactions (FDR < 0.01) for 1-Mbp bins. Points represent 1-Mbp bins. According to the distribution of two numbers, bins were classified into three categories: increased-, decreased-, and unchanged-interaction bins. (D–G) Box plots of histone modification enrichments of G for three categories of bins. P-values were calculated with a Wilcoxon test. (H) Differential interactions within and between increased- and decreased-interaction bins. This map was generated by extracting differential interactions of the increased- and decreased-interaction bins from the whole-genome differential interaction map (panel A). Right panel shows the enrichments of histone modifications of G and fold changes of H3K9me3 and H3K27me3 between DS and G. The heatmap verifies the tendency of increased interactions between heterochromatin and decreased interactions between euchromatin. Bins showing increased interactions had relative increased H3K27me3 and decreased H3K9me3.