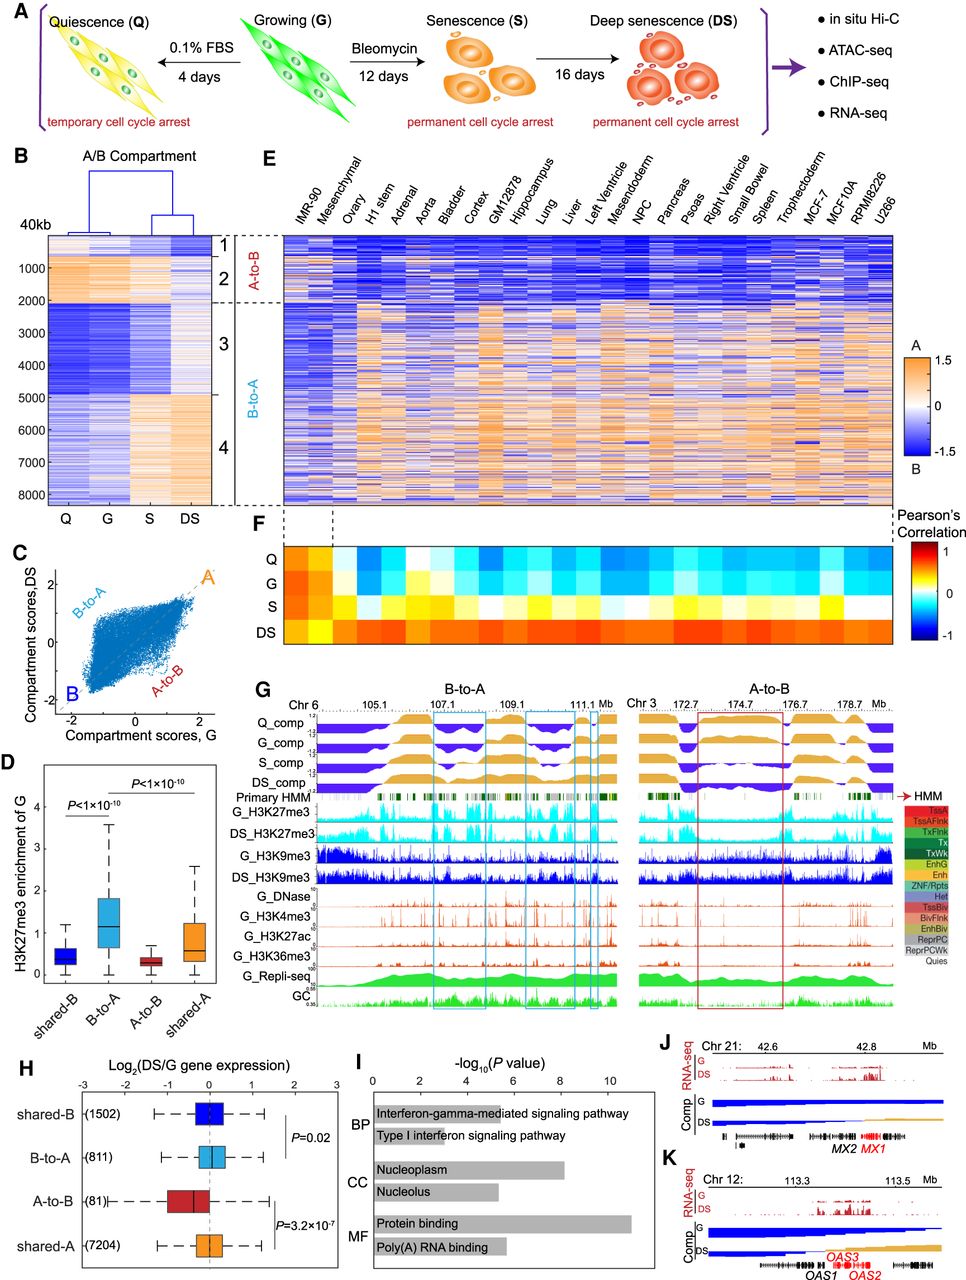
Compartment switching of H3K27me3-associated heterochromatin. (A) The study design. Each cell state has two biological replicates. (B) Hierarchical clustering of the differential compartment bins. There are four clusters, out of which clusters 1 and 2 correspond to the A-to-B category and clusters 3 and 4 correspond to the B-to-A category. (C) Scatterplot of compartment scores in G versus DS. Each point represents a 40-kbp bin, and B-to-A regions occupy a higher proportion than A-to-B regions. (D) Box plots of H3K27me3 enrichment of G for four compartment categories—shared-B, B-to-A, A-to-B, and shared-A. Shared-B and shared-A were used as a control group. B-to-A regions show significantly higher enrichment of H3K27me3. A Wilcoxon test was used to identify the statistical significance. (E) Compartment scores of 25 published Hi-C profiles in the differential compartment bins obtained from panel B. (F) Pearson's correlation between four cell states and 25 published Hi-C profiles in terms of the differential compartment bins. (G) WashU Epigenome Browser views of compartment switching. B-to-A regions are overlapped with H3K27me3 and Polycomb chromatin state, while A-to-B regions are depleted in measured histone modifications. (H) Box plots of fold changes of gene expression in four categories. The numbers of genes included in each category are labeled. Statistical analysis was performed by Wilcoxon test. (I) Gene Ontology of derepressed genes in B-to-A regions. (BP) Biological process, (MF) molecular function, (CC) cellular component. Top two terms in each annotation category are shown. (J,K) Browser views of some derepressed genes in B-to-A regions.