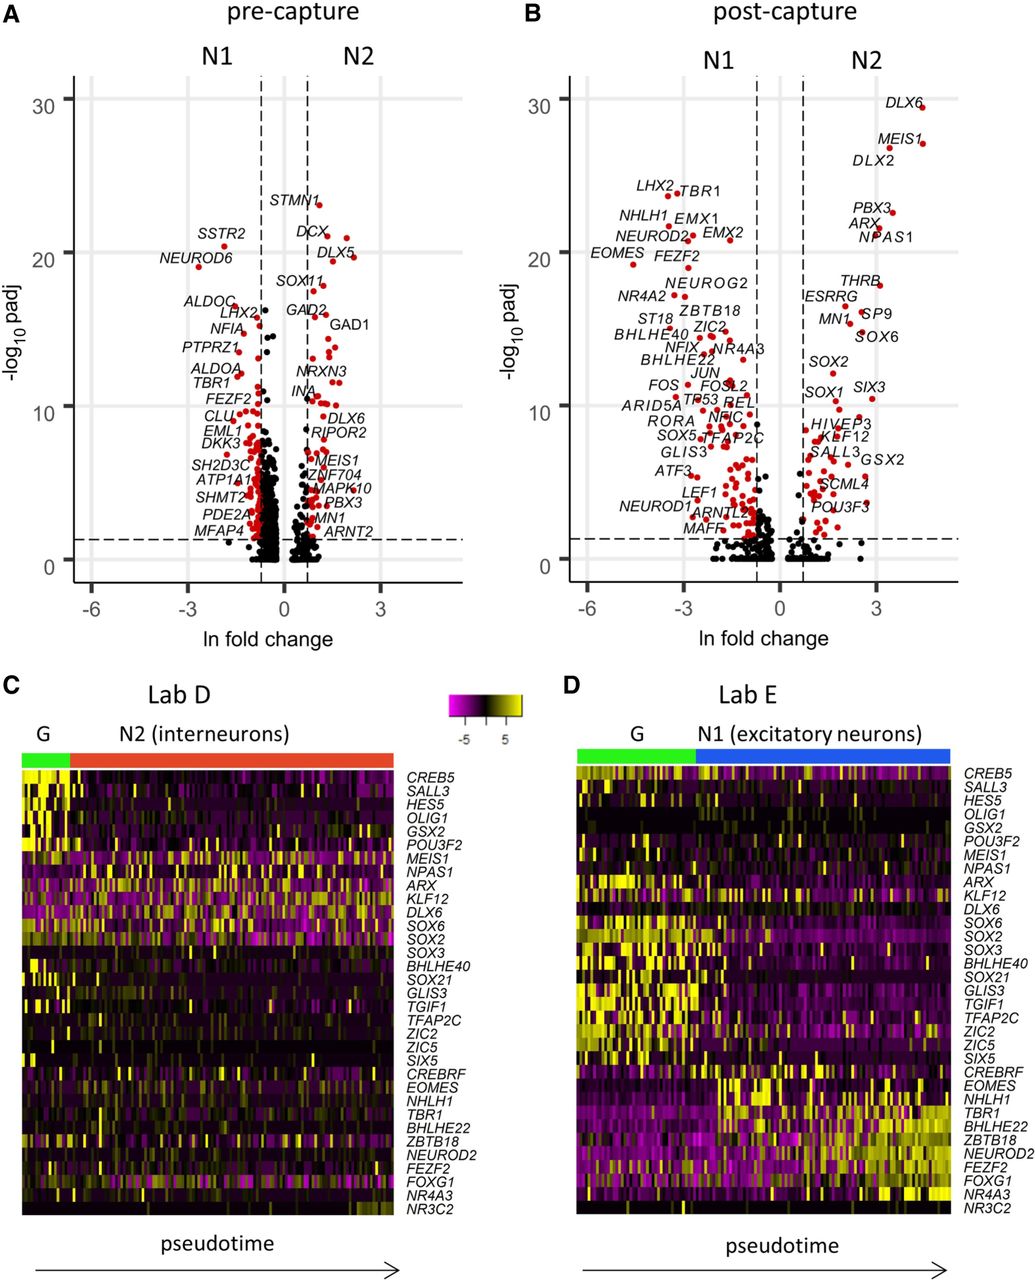
TF scCapture-seq reveals differentially expressed genes underlying inter-laboratory variability. (A) Volcano plot of all pre-capture DEGs between N1 and N2 neurons (based on pre-capture gene expression in cells of cluster 1 vs. cells of clusters 3 and 4). (B) Volcano plot of all post-capture DEGs between N1 and N2 neurons (based on post-capture gene expression in cells of clusters N1 vs. N2). Significant DEGs are labeled (FDR ≤ 0.05, natural log fold changes ≥ 0.5). (C,D) Heat maps of post-capture expression of the key TF DEGs with different temporal kinetics between the laboratories. Each heatmap includes only cells from the respective laboratory: Lab D (C) or Lab E (D). The cells are ordered by pseudotime (based on all cells, as in Fig. 5A,B), including cells of the earlier G cluster. Expression is log2-normalized and centered.