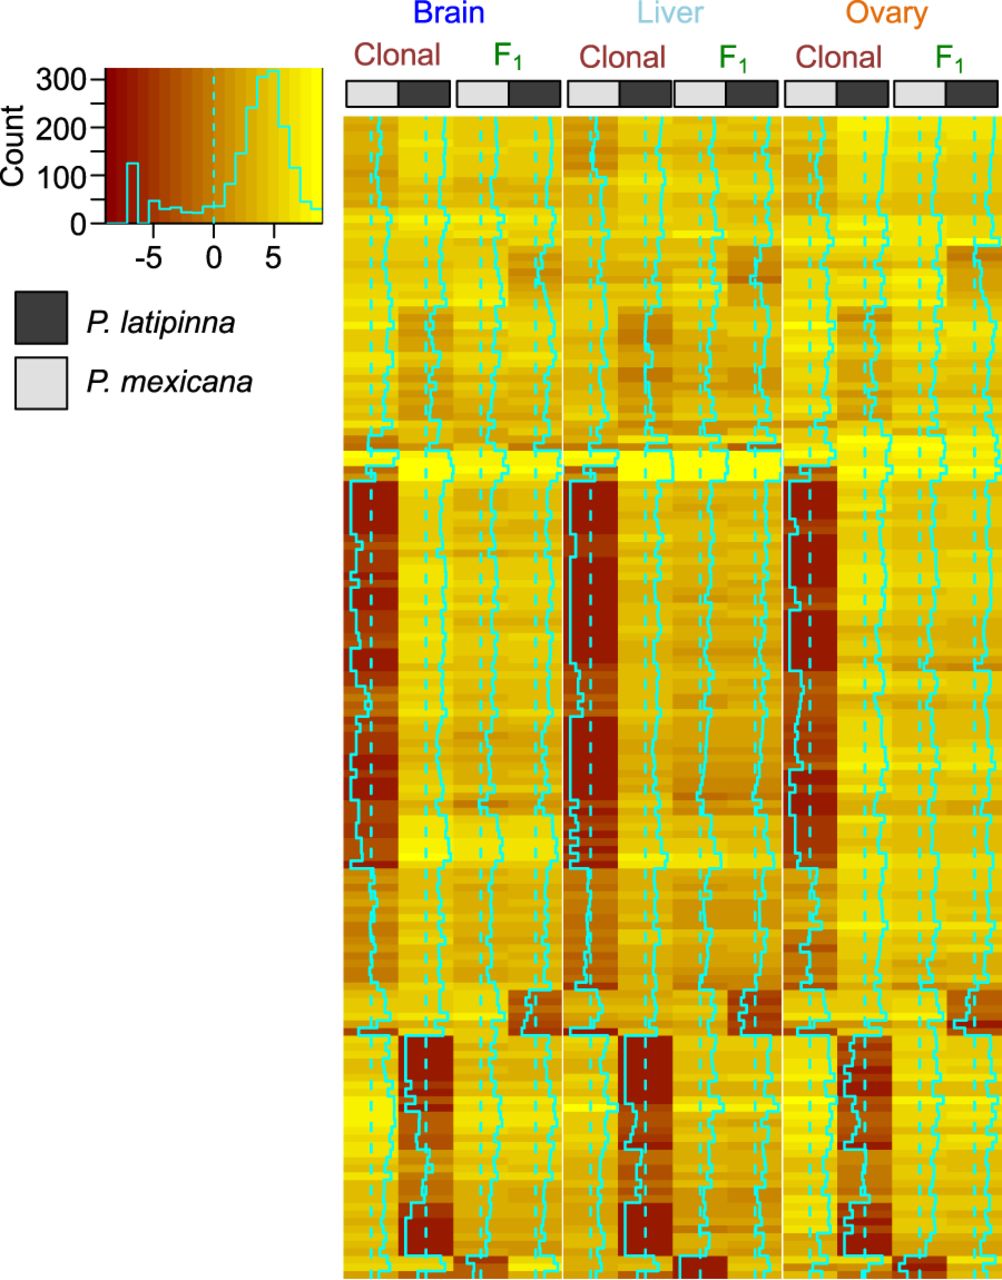
Differences in allelic expression pattern between clonal P. formosa and interspecies F1 hybrid. A total of 153 genes were identified to display allelic expression pattern differences between the clonal and interspecies F1 hybrid progeny in all three organs assessed. The heatmap represents allelic expression in different organs and cohorts. Colored blocks represent mean Log2 allelic expression. Cyan dashed lines in the color blocks mark the center value (0) of the heatmap, and the solid lines that are close to the center dashed line display the allelic expression value. If the line is on the left of the dashed line, the given allele is lowly expressed. If the line is on the right of the dashed line, the given allele is relatively highly expressed. Color key displays the relationship between colors and values of allelic expression, with the histogram showing the summary of allelic expression levels for all genes.