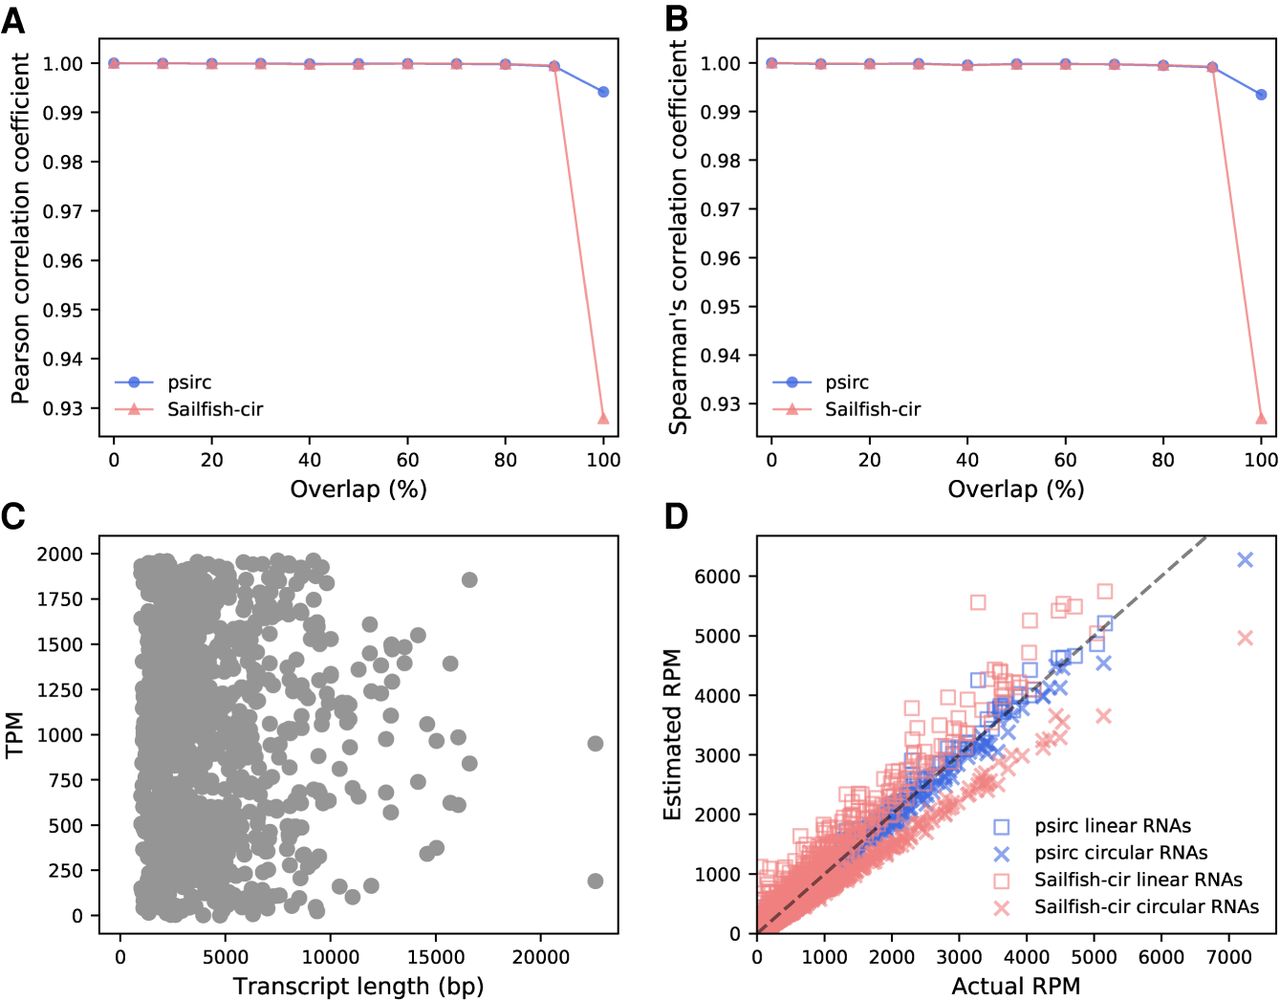
Figure 3.
Quantification performance of psirc and Sailfish-cir on the first simulated data set. Pearson (A) and Spearman's (B) correlation coefficients were computed between the estimated and actual expression levels for the 1000 transcript isoforms in each of the 11 groups. For the group with 100% sequence overlap between linear and circular transcript isoforms, the scatter plots show the actual expression levels in transcripts per million (TPM) against transcript lengths (C) and the read counts per million reads aligned (RPM) estimated by the two methods against the actual read count of each transcript isoform (D).