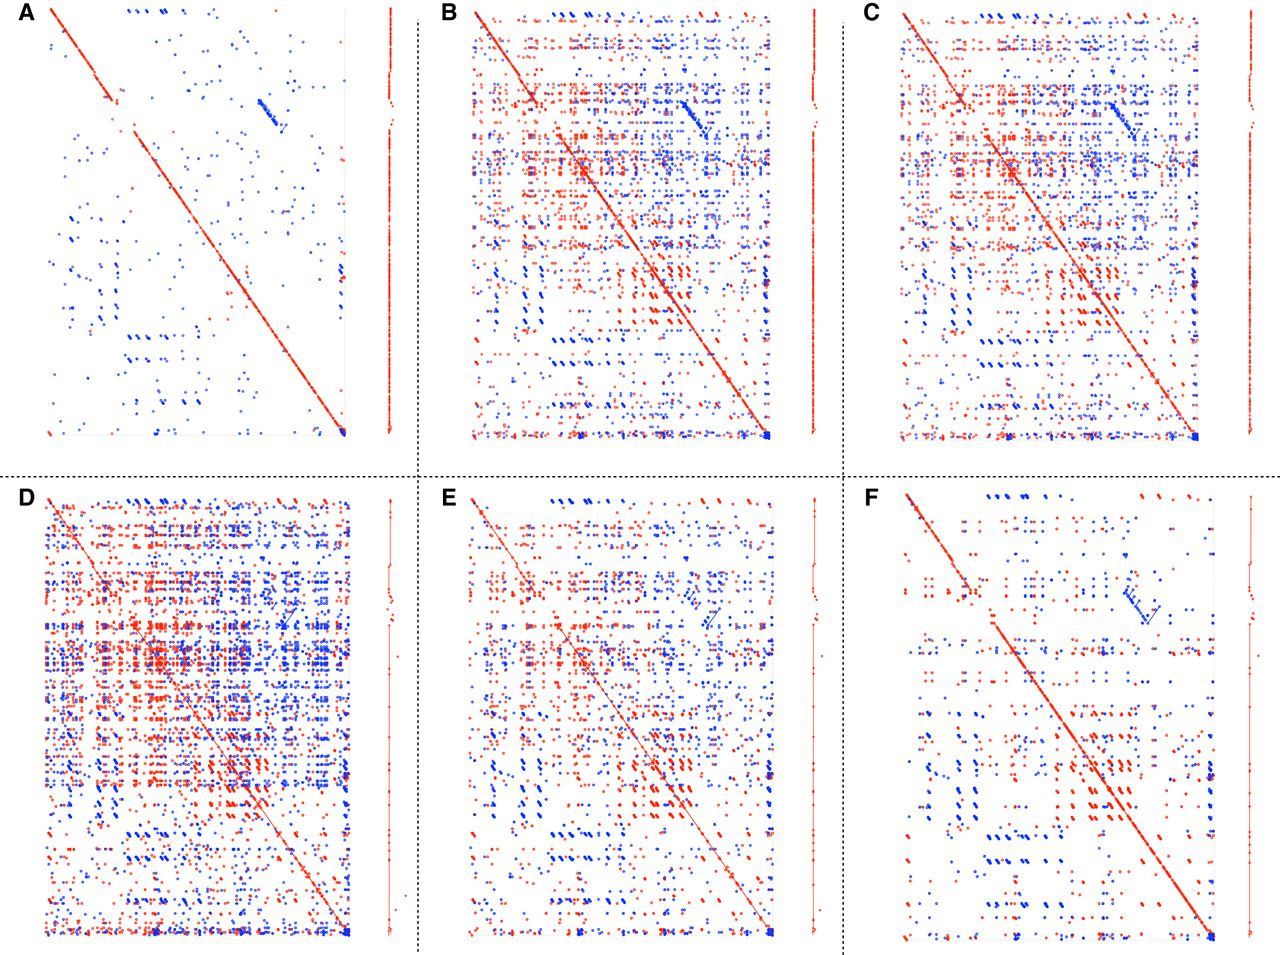
Figure 5.
Dotplots and the optimal collinear chain solution produced by MEMs, MUMs, and NAMs from mapping two different E. coli genomes to each other. Each panel shows dotplots of all matches (left) and the optimal collinear chaining solution produced by the matches (right). The chaining solution has been put in vertical position for display. The panels show MUMmer with MUMs of a minimum size of 30 (A), MUMmer with MEMs of a minimum size of 30 (B), StrobeMap with k-mers of a size 30 (C), StrobeMap with (2,15,1,100) randstrobes (D), StrobeMap with (2,15,16,100) randstrobes (E), and StrobeMap with (3,10,11,100) randstrobes (F).