Figure 3.
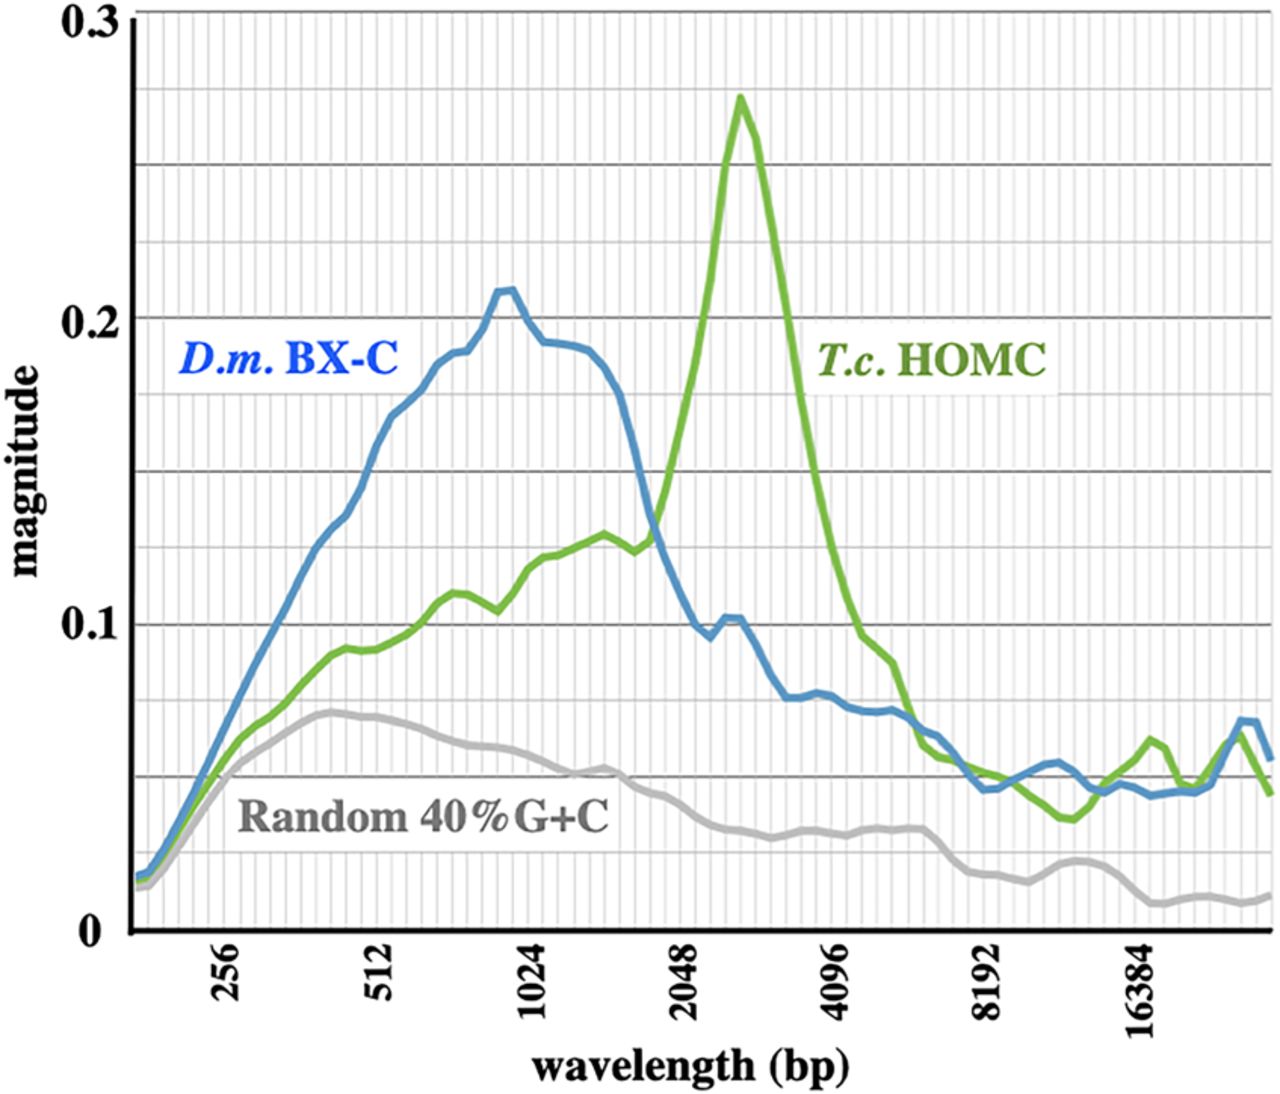
Average magnitude graphs of the continuous wavelet transforms shown in Figure 2. The magnitude metric on the y-axis shows the signal strength relative to that of a perfect sine wave.
Average magnitude graphs of the continuous wavelet transforms shown in Figure 2. The magnitude metric on the y-axis shows the signal strength relative to that of a perfect sine wave.