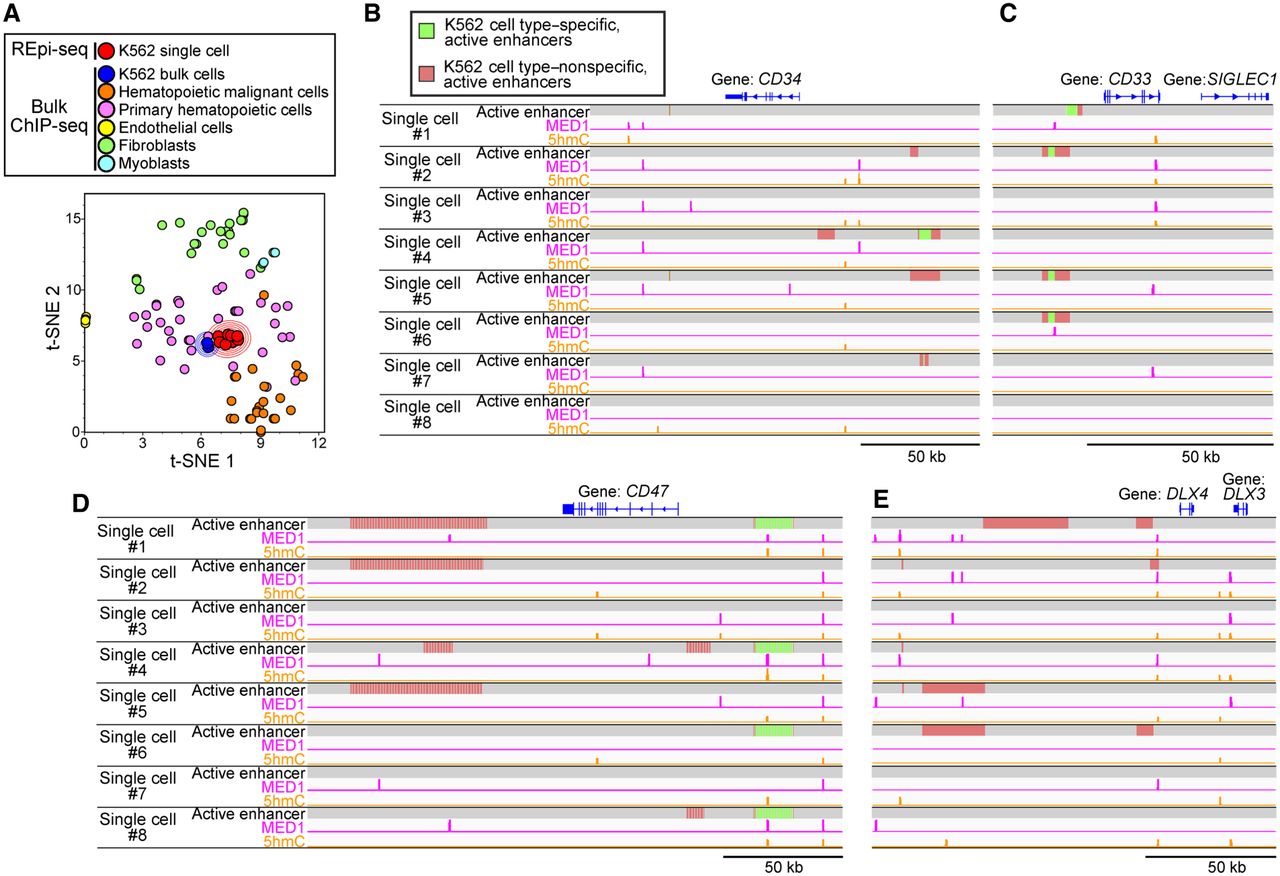
Visualization of epigenetic signatures generated by REpi-seq using dimensionality reduction. (A) Dimensionality reduction of whole data sets generated by REpi-seq and bulk ChIP-seq. Epigenetic status of enhancers and promoters was determined from bulk ChIP-seq data of various cell types and from REpi-seq of eight K562 cells by log2(H3K27ac/H3K27me3), as detailed in the Supplemental Methods. K562 single cells analyzed by REpi-seq (red) were compared with bulk cells, K562 bulk cells (blue), hematopoietic malignant cell lines (orange, nine cell lines), primary hematopoietic cells (magenta, 15 cell types), endothelial cells (yellow, one cell type), fibroblasts (green, four cell lines and four types primary cells), and myoblasts (light blue dots, one primary cell type). Bulk ChIP-seq data are from the ENCODE (148 data sets, listed in Supplemental Table S4). Dimensions of cell data were compressed by t-stochastic neighbor embedding (t-SNE). (B–E) Identified active enhancers, MED1, and 5hmC reads by statistical analysis. Significant activation of enhancers was determined by the bootstrap procedure (false-positive rates <5%) using data sets of H3K27ac and H3K27me3 generated by REpi-seq. Identified active enhancers were further classified into K562 cell type–specific, active enhancers (green), and K562 cell type–nonspecific, active enhancers (red) by bulk ChIP-seq data. MED1 and 5hmC reads (false-positive rates <1%) were also identified by statistical analysis, the bootstrap procedure. Loci of CD34 (B), CD33 (C), CD47 (D), and DLX4 (E) are shown. See also Supplemental Figure S12.