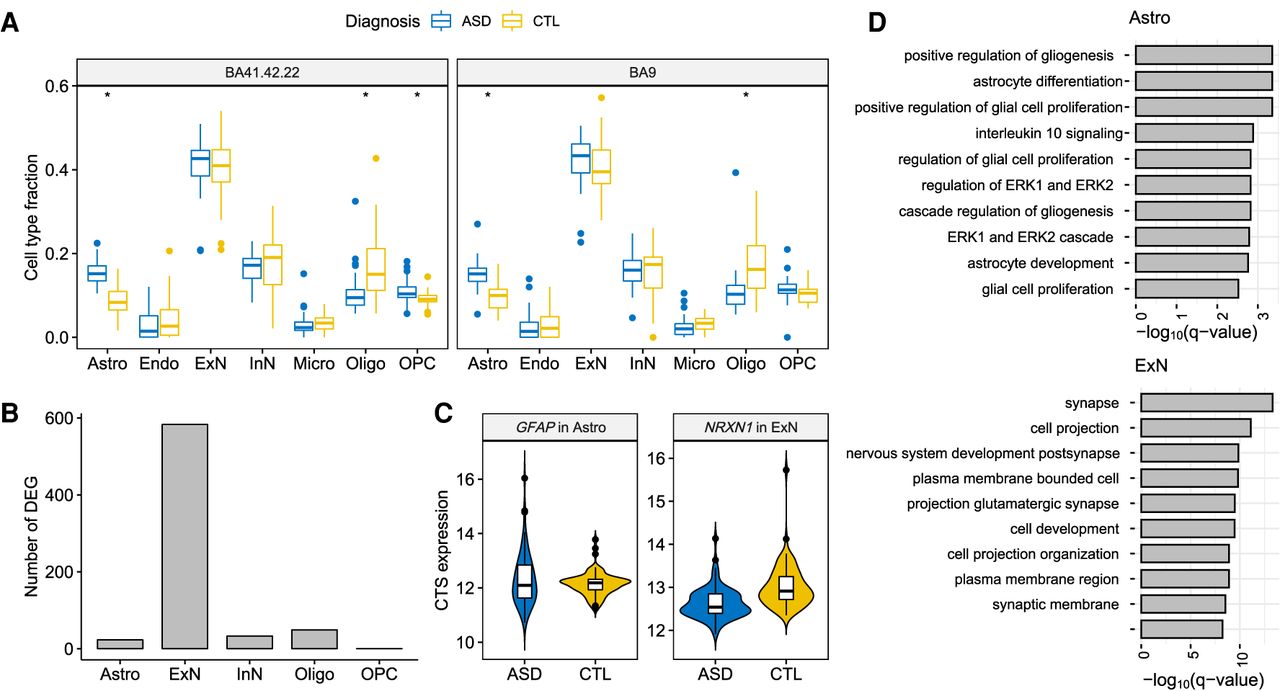
Figure 4.
CTS differential expression analysis of autism. (A) Estimated cell type fractions for two cortical regions of the PsychENCODE UCLA-ASD data (Parikshak et al. 2016). (*) Significance after Bonferroni adjustment (P-value <0.05/14) comparing fractions of ASD and control samples. (B) Number of CTS DEGs identified by bMIND in each cell type. (C) Examples of bMIND-identified CTS DEGs. (D) Gene Ontology enrichment analysis for CTS DEGs in astrocytes and excitatory neurons: top 10 terms with FDR <0.05.