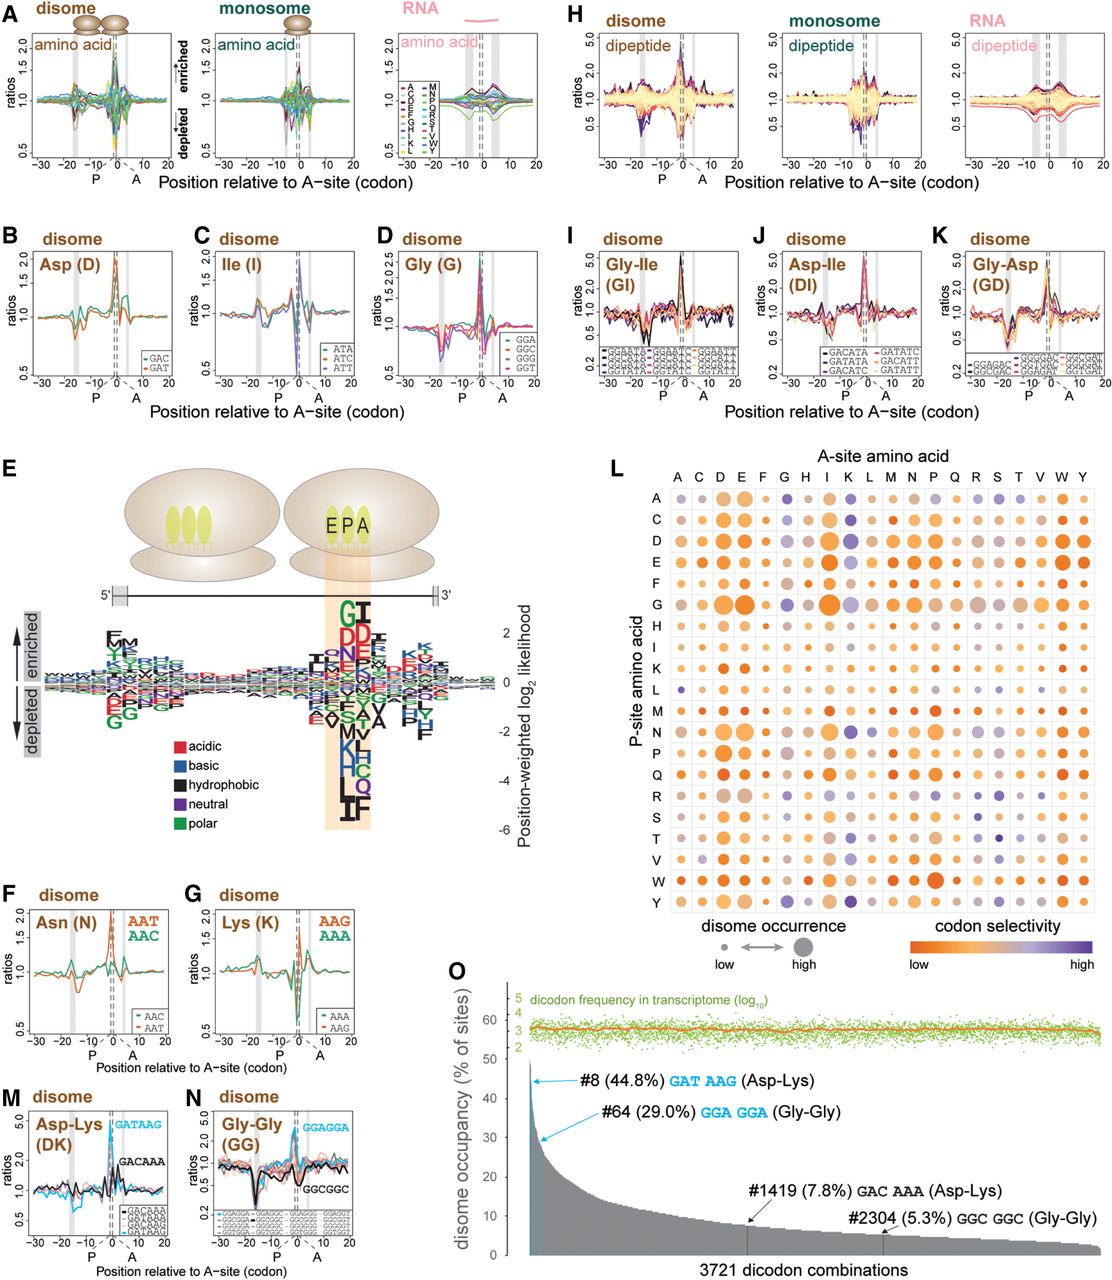
Disome sites show specific amino acid and codon enrichment. (A) Position-specific enrichment analysis reveals selectivity for amino acids in the decoding center of paused ribosomes. Normalized ratios of observed-to-expected occurrences (y-axis, log-scaled) of nucleotide triplets, grouped by the amino acid they code (inset in right plot), are plotted for each codon position relative to the estimated A-site (0 at x-axis) of the leading ribosome of disomes (left), or of the individual ribosome in the case of monosomes (middle). For total RNA (right), position 0 denotes the midpoint of the reads. Ratios above and below 1 suggest enrichment and depletion, respectively. The vertical gray bars indicate the positions of the 5′ and 3′ ends of the read inserts for different library types. A- and P-sites are marked by vertical dashed lines. (B–D) Position-specific enrichment plots of sequences coding for representative amino acids at and around pause sites identified by disomes. Similar to A, yet triplets were not combined into amino acids but instead shown individually (inset) for aspartic acid (Asp), isoleucine (Ile), and glycine (Gly), respectively, in B–D. (E) Position weight matrix of sequence triplets grouped by amino acids illustrates enrichment and depletion of specific amino acids within the decoding center of the leading ribosome of the disomes. Position-specific weighted log2-likelihood scores were calculated from the observed-to-expected ratios (A). Enrichment and depletion carry positive and negative scores, respectively. Height of each single-letter amino acid character is determined by its absolute score. At each codon position, letters were sorted by the absolute scores of the corresponding amino acids, in descending order. Letters are colored by amino acid hydrophobicity and charge. The ribosome pair and their footprint are depicted graphically at the top, with gray zones at the extremities of the footprint denoting the spread of 5′ and 3′ ends of the read inserts. (F,G) Similar to B, for asparagine (Asn) (F) and lysine (Lys) (G). (H) Position-specific enrichment plots for dipeptides. Similar to A, but instead of triplets and single amino acids, 6-mers coding for a pair of amino acids (dipeptides) were used to calculate the observed-to-expected ratios for all possible dipeptides. Color code is not given due to vast number of dipeptides. (I–K) Similar to B, showing enrichment of individual 6-mers for dipeptides Gly-Ile (I), Asp-Ile (J), and Gly-Asp (K). (L) Enrichment and codon selectivity of all amino acid combinations at the predicted P- and A-sites of the leading ribosome. Identities of amino acids at the P- and A-sites are resolved vertically and horizontally, respectively. Disk area and color represent enrichment of disome sites and codon selectivity, respectively. Codon selectivity is calculated as the difference between the max. and min. enrichment ratios (log) of all 6-mers coding for a given dipeptide. (M,N) As in I–K, for Asp-Lys (M) and Gly-Gly (N). Disome-prone and disome-poor codon usages are marked in blue and black, respectively. (O) Relative disome occupancy by dicodon. Disome occupancy for the 3721 dicodon combinations was plotted in descending order. Occupancies were calculated for a given 6-mer (dicodon) as the raw percentage of sites with disome to all present sites (with + without disome) across the studied transcriptome. The frequency of sites is shown at the top of the graph colored in lime (moving average trend line in orange). Annotated are two pairs of 6-mers from panels M and N, coding for Asp-Lys or Gly-Gly, which show large differences in disome occupancies depending on codon usage (blue vs. black for high vs. low occupancy, respectively).