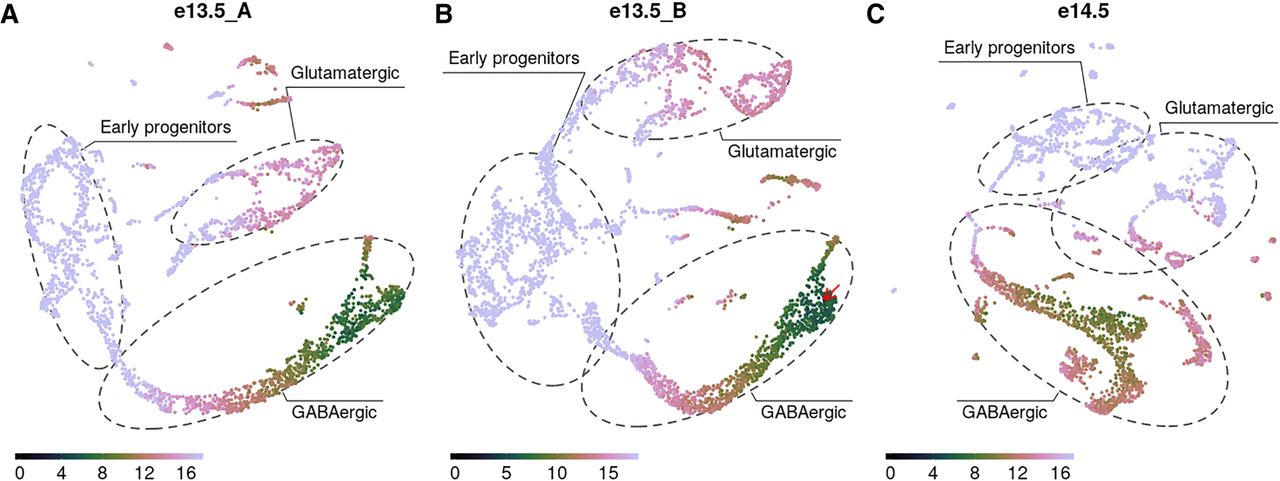
Figure 4.
Sleepwalk in multisample mode, comparing three samples of a developing murine cerebellum: two samples of two different mice embryos at time point E13.5 (A,B) and the third (C) from E14.5. The red arrow shows the current mouse position. The dashed gray lines roughly indicate two different lineages and their common progenitor cells (expression of the marker genes that we used to draw the boundaries is shown in Supplemental Fig. S1). By following the GABAergic branch, one can notice that its very tip in the E13.5 samples corresponds to cells in the middle of the branch in E14.5, indicating that the cells have differentiated further during the elapsed day.