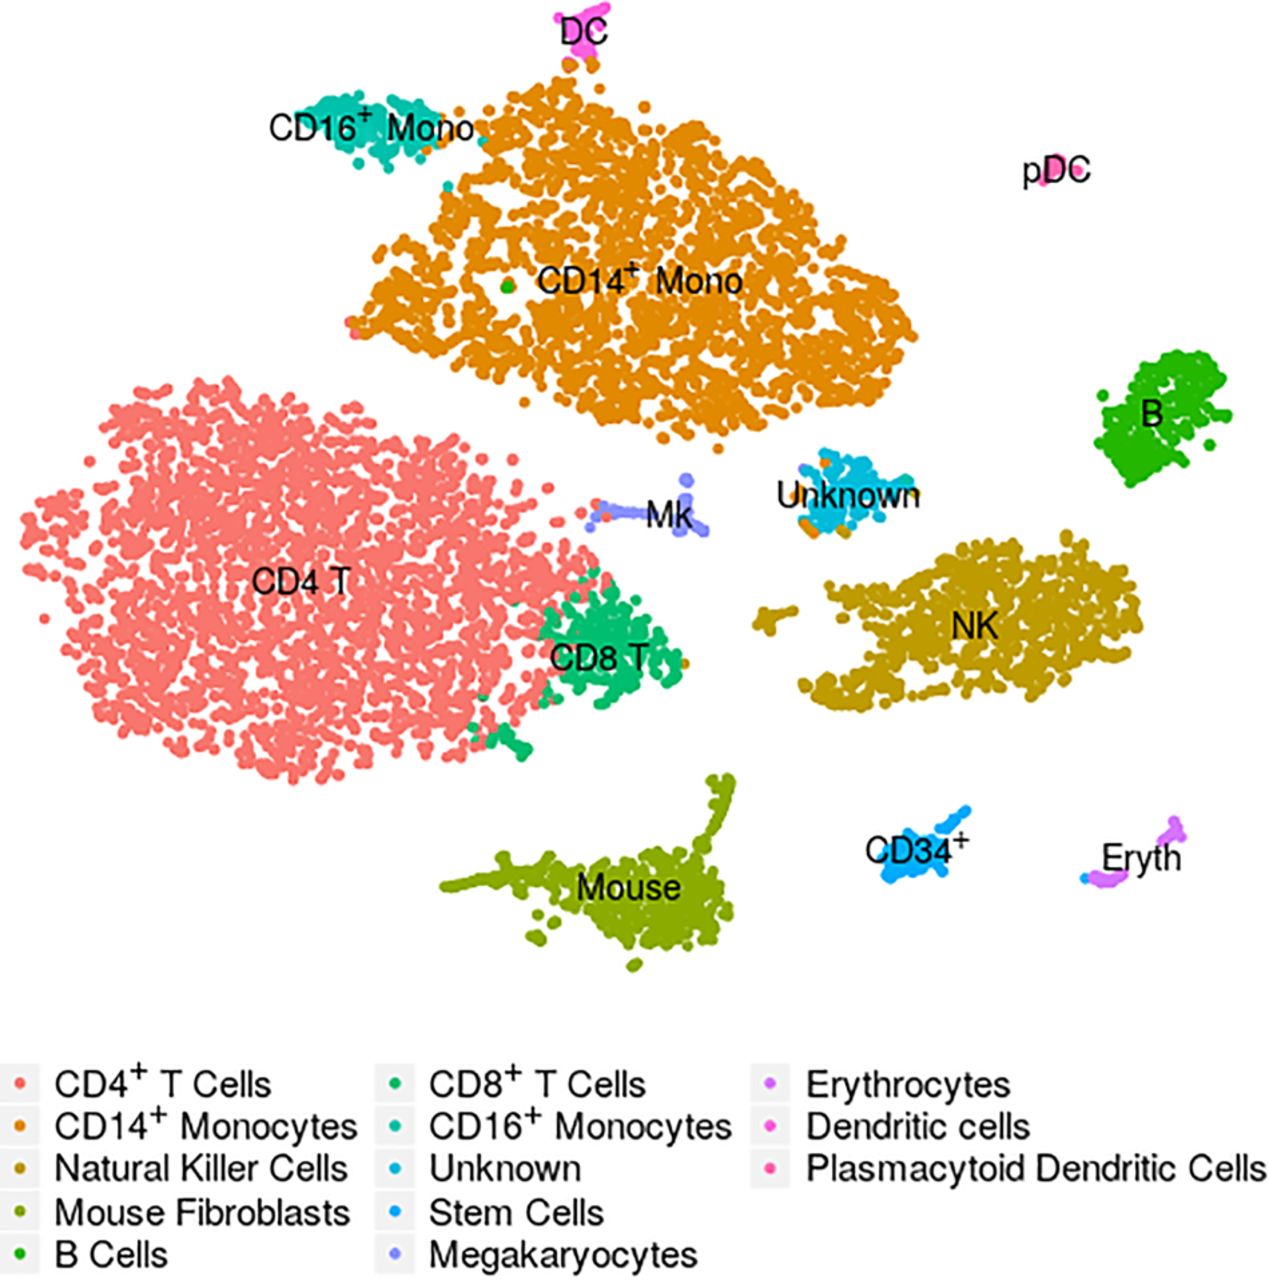
Figure 1.
Example of a t-SNE plot: These are cord-blood mononuclear cells studied by Stoeckius et al. (2017). The embedding and the assignment of cell types have been taken from the Seurat (Butler et al. 2018) tutorial that uses this data set as an example (Satija Lab 2018).