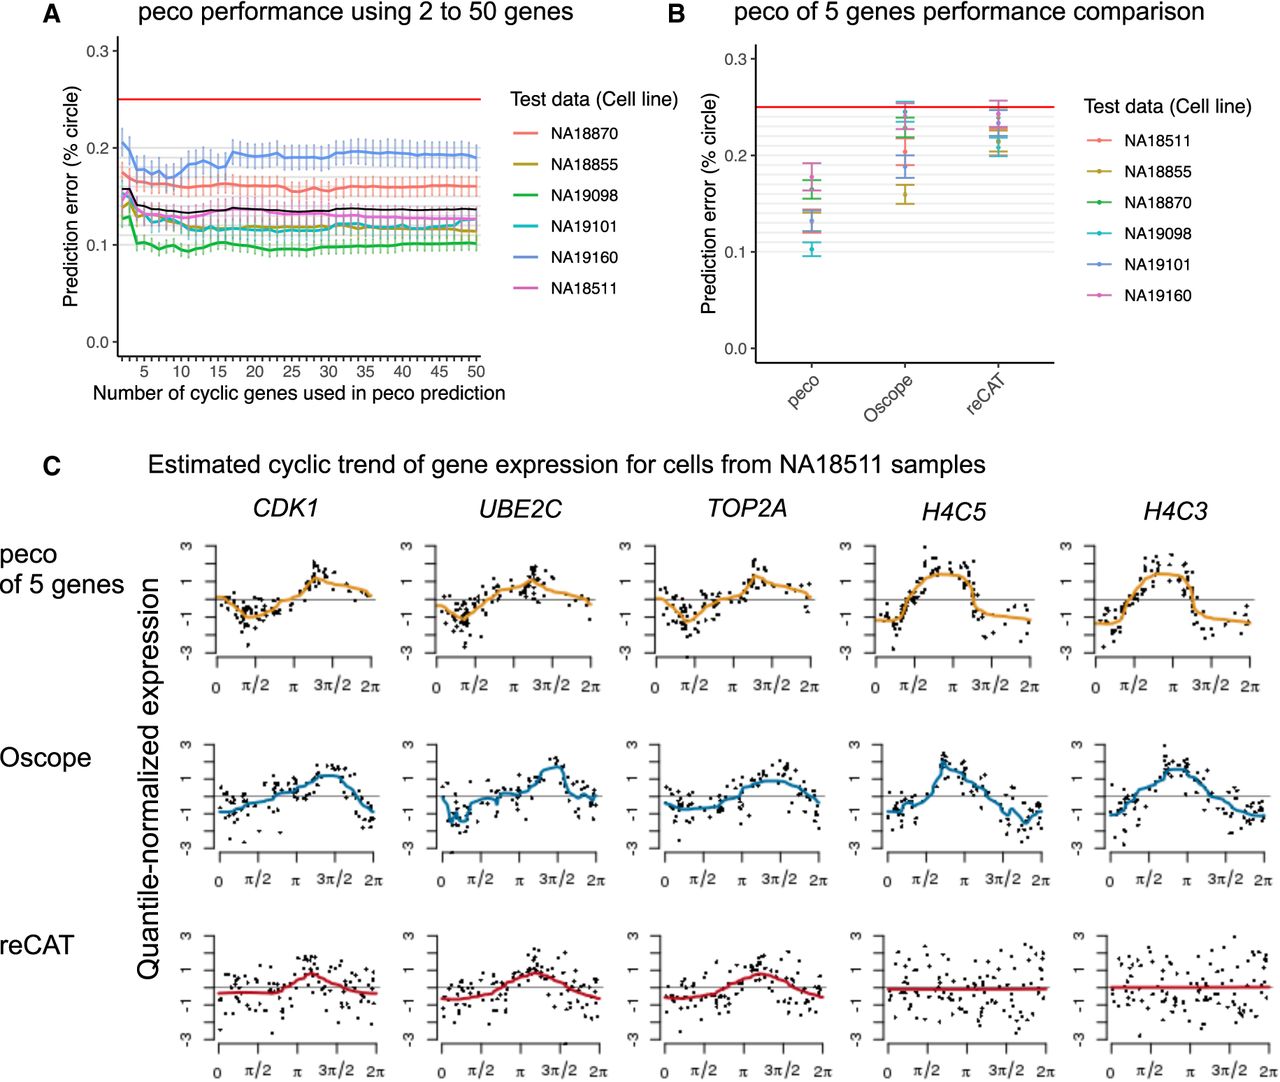
Inferring cell cycle phase from scRNA-seq data. (A) We applied sixfold cross-validation to test the performance of our predictor. In each fold, we trained our predictor on cells from five individuals and tested its performance on cells from the remaining individual. The y-axis corresponds to prediction error (between 0% to 25%, or π/4), and x-axis corresponds to the number of top cyclic genes used in the predictor. The six colored lines correspond to performances in the six folds, specifically average prediction error among cells in the test samples. Error bars, SEs. (B) Performance comparison of peco built from the top five cyclic genes (CDK1, UBE2C, TOP2A, H4C5, and H4C3) with Oscope (Leng et al. 2015) and recAT (Liu et al. 2017). (C) Estimated cyclic trend of top five cyclic genes for samples from cell line NA18511. The rows correspond to prediction results from peco of five genes, Oscope and reCAT. For the Oscope/reCAT results, we ordered the single-cell samples from NA18511 using the Oscope/reCAT-based predicted phase (based on 888 samples in the data) and used trendfilter to estimate cyclic trend of gene expression. For the peco results, we ordered the samples according to the predicted phase and used trendfilter to estimate cyclic trend of gene expression. The colored line corresponds to the estimated cyclic expression level along the predicted phase.