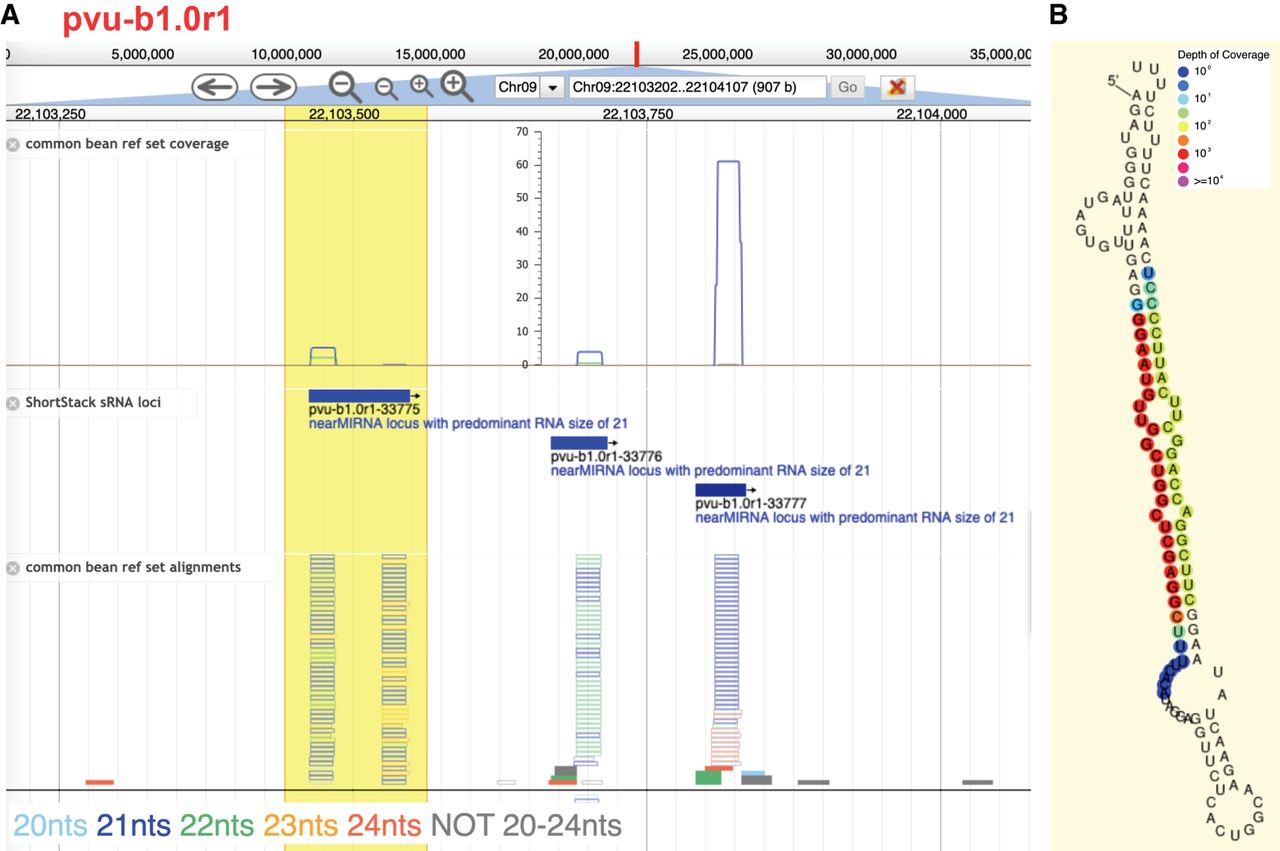
Example screenshots from https://plantsmallrnagenes.science.psu.edu. (A) Screenshot of genome browser for a region of Phaseolus vulgaris Chromosome 9. Coverage track shows sRNA-seq alignment depths from the reference set, separated by sRNA lengths (indicated by colors). ShortStack sRNA loci track shows sRNA locus annotations. Alignments track shows individual sRNA reads from the reference set, with lengths indicated by colors. Hollow bars indicate multimapped reads; solid bars are uniquely mapped reads. A user-highlighted region is indicated in yellow. (B) Analysis of predicted RNA secondary structure with sRNA-alignment depths indicated by colors (powered by strucVis, which is embedded within the site and also available in standalone fashion at https://github.com/MikeAxtell/strucVis). This analysis is one of several that can be triggered by user selection of a region of interest (yellow region in A).