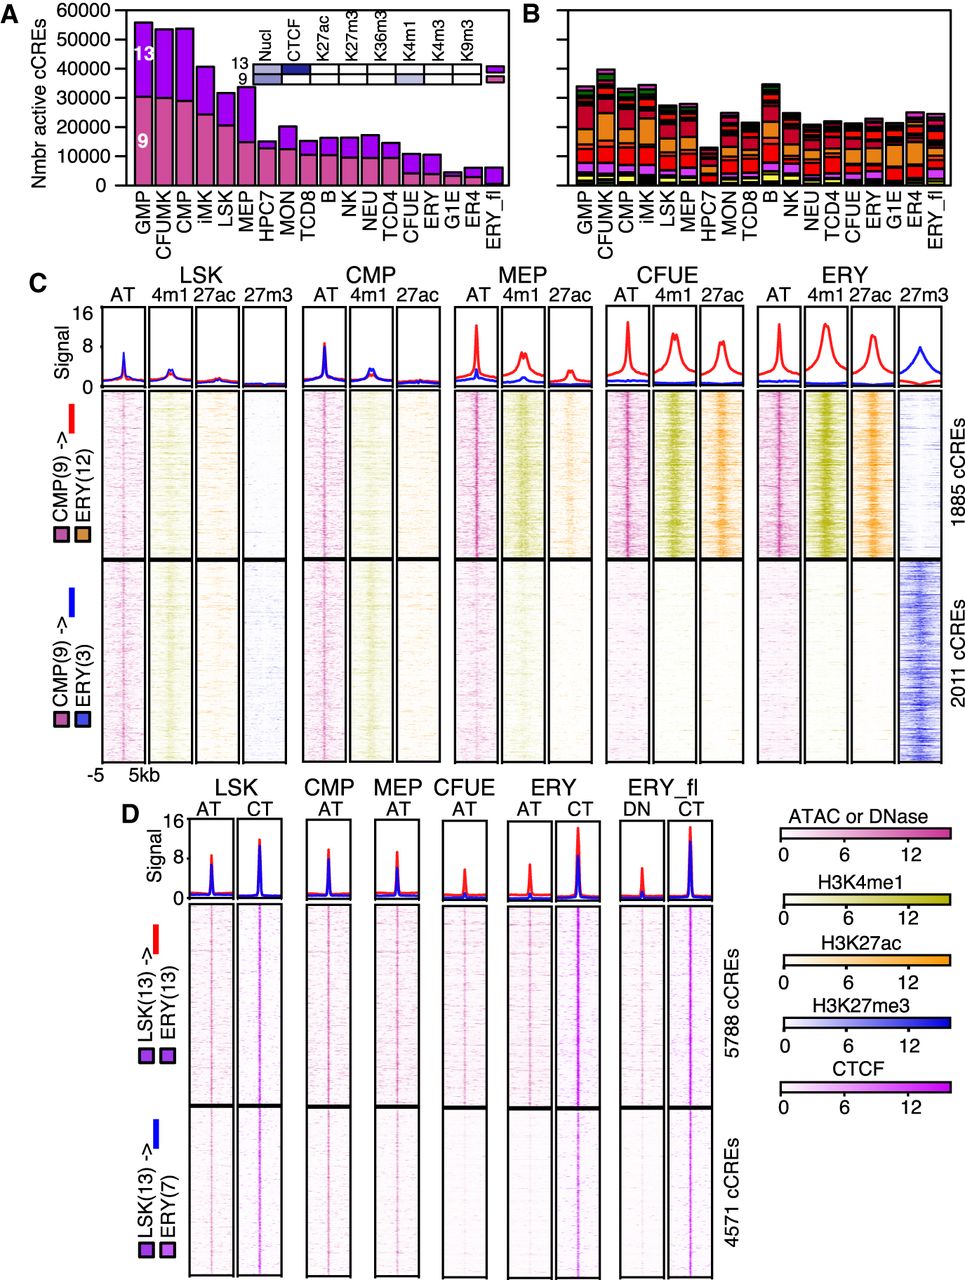
Transitions in epigenetic states at cCREs across hematopoietic differentiation. (A,B) The numbers of cCREs in each cell type are colored by their IDEAS epigenetic state, emphasizing decreases in numbers of cCREs in states 9 and 13 (A), whereas numbers in other states are less variable (B). (C) Aggregated and individual signal profiles for cCREs in the poised enhancer state 9 in CMPs as they transition from LSK through CMP and MEP to CFUE and ERY. Profiles for up to four relevant epigenetic features are presented. Data for H3K27me3 are not available for CMP, MEP, or CFUE. The first graph in each panel shows the aggregated signal for all cCREs in a class, and graphs below it are heatmaps representing signal intensity in individual cCREs. In the aggregated signal, red lines show signals for cCREs that transition from poised state 9 to active enhancer-like state 12, and blue lines show signals for cCREs that transition from poised state 9 to polycomb repressed state 3. (D) Aggregated and individual signal profiles for CTCF-bound cCREs that either retain or lose nuclease accessibility during differentiation from LSK to ERY. In the aggregated signal, red lines show signals for cCREs that stay in the CTCF-bound, nuclease-sensitive state 13, and blue lines show signals for CTCF-bound cCREs that lose nuclease sensitivity as they transition from state 13 to state 7. Signals were normalized by S3norm. (AT) ATAC; (4m1) H3K4me1; (27ac) H3K27ac; (27m3) H3K27me3; (CT) CTCF.