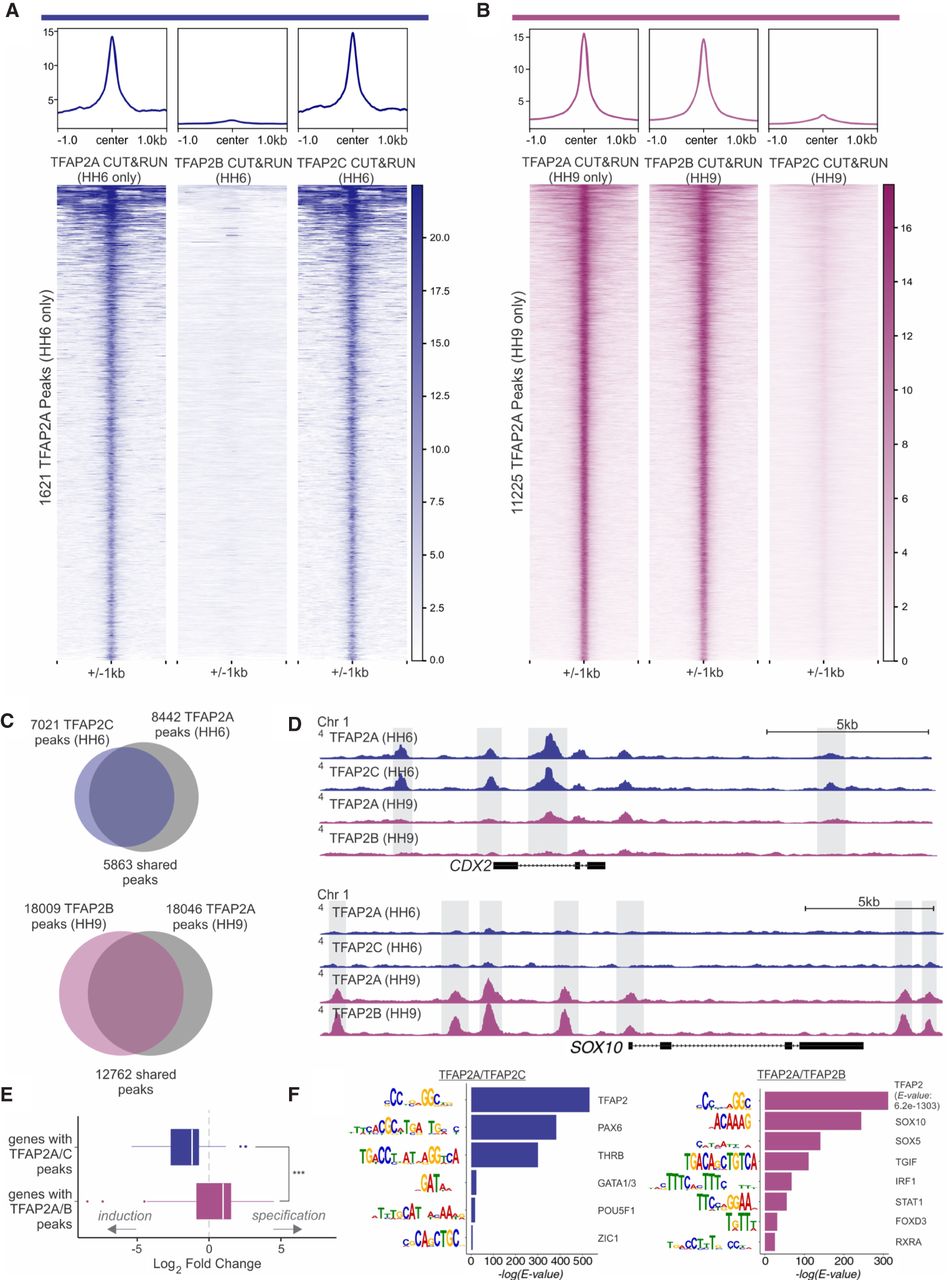
TFAP2A/C have shared regulatory targets in induction, whereas TFAP2A/B have shared targets in specification. (A) Profiles and heatmaps displaying signal for TFAP2A, TFAP2B, and TFAP2C at induction-specific TFAP2A peaks (1621 peaks). (B) Profiles and heatmaps displaying signal for TFAP2A, TFAP2B, and TFAP2C at specification-specific TFAP2A peaks (11,225 peaks). (C) At induction (HH6), CUT&RUN analysis identified 8442 TFAP2A peaks and 7021 TFAP2C peaks, 5863 of which co-occupied by both TFAP2A and TFAP2C. During specification, 18,046 TFAP2A peaks and 18,009 TFAP2B peaks were detected, with an overlap of 12,762 peaks occupied by both TFAP2A and TFAP2B. (D) CUT&RUN profiles for TFAP2A/C at induction (HH6) and TFAP2A/B and at specification (HH9) in the loci of CDX2 and SOX10. (E) Boxplot displaying distribution of genes significantly enriched (Padj < 0.1) at HH6 versus HH10 that have TFAP2A/C peaks TFAP2A/B in their loci. Genes with associated TFAP2A/C peaks are enriched during induction, whereas genes annotated with TFAP2A/B peaks are enriched during specification. (F) Rank-ordered results of motif enrichment analysis of TFAP2A/C peaks and TFAP2A/B peaks via MEME-ChIP. Values indicate significance of motif occurrence as reported by MEME (redundant motifs have been omitted). (HH) Hamburger Hamilton; (kb) kilobase. (***) P ≤ 0.001.