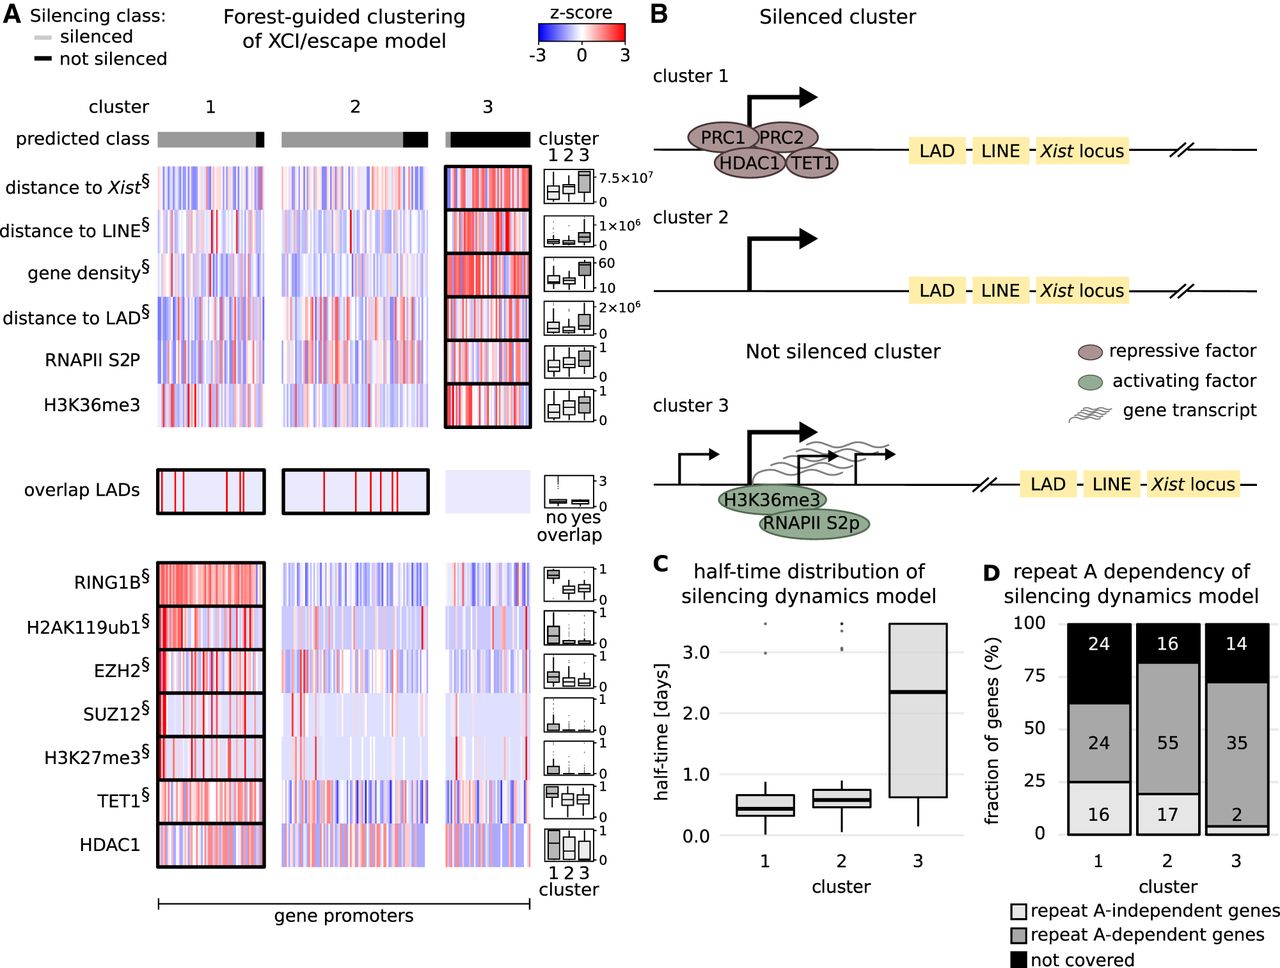
Classification rules for the XCI/escape model. (A) Results from the forest-guided clustering of the XCI/escape model visualized as a heatmap. Columns indicate the genes grouped by cluster; rows correspond to features with significant differences among clusters (ANOVA test). (§) The top 10 most significant features from the ANOVA test. Distributions of features in each cluster are shown in the box plots next to the heatmap, except for the feature "overlap LADs," where the number of genes in each category is shown. (B) Schematic view of the feature combinations promoting gene silencing (clusters 1 and 2) or escape (cluster 3). (C) Silencing half-time distribution in each cluster. (D) Proportion of genes in each cluster that undergo silencing in mouse trophoblasts, independent or dependent of the Xist-repeat A element (Sakata et al. 2017): (repeat A–dependent genes) genes with abrogated silencing in Xist-repeat A-mutant cells; (repeat A–independent genes) genes that still undergo silencing in the same cells; (not covered) our genes that were not covered in that data set. The numbers in each box indicate the number of genes that fall into each category. Similar results are obtained from the XCI/escape model trained on undifferentiated mRNA-seq data (Supplemental Fig. S20; Supplemental Text S8).