Skip to main content
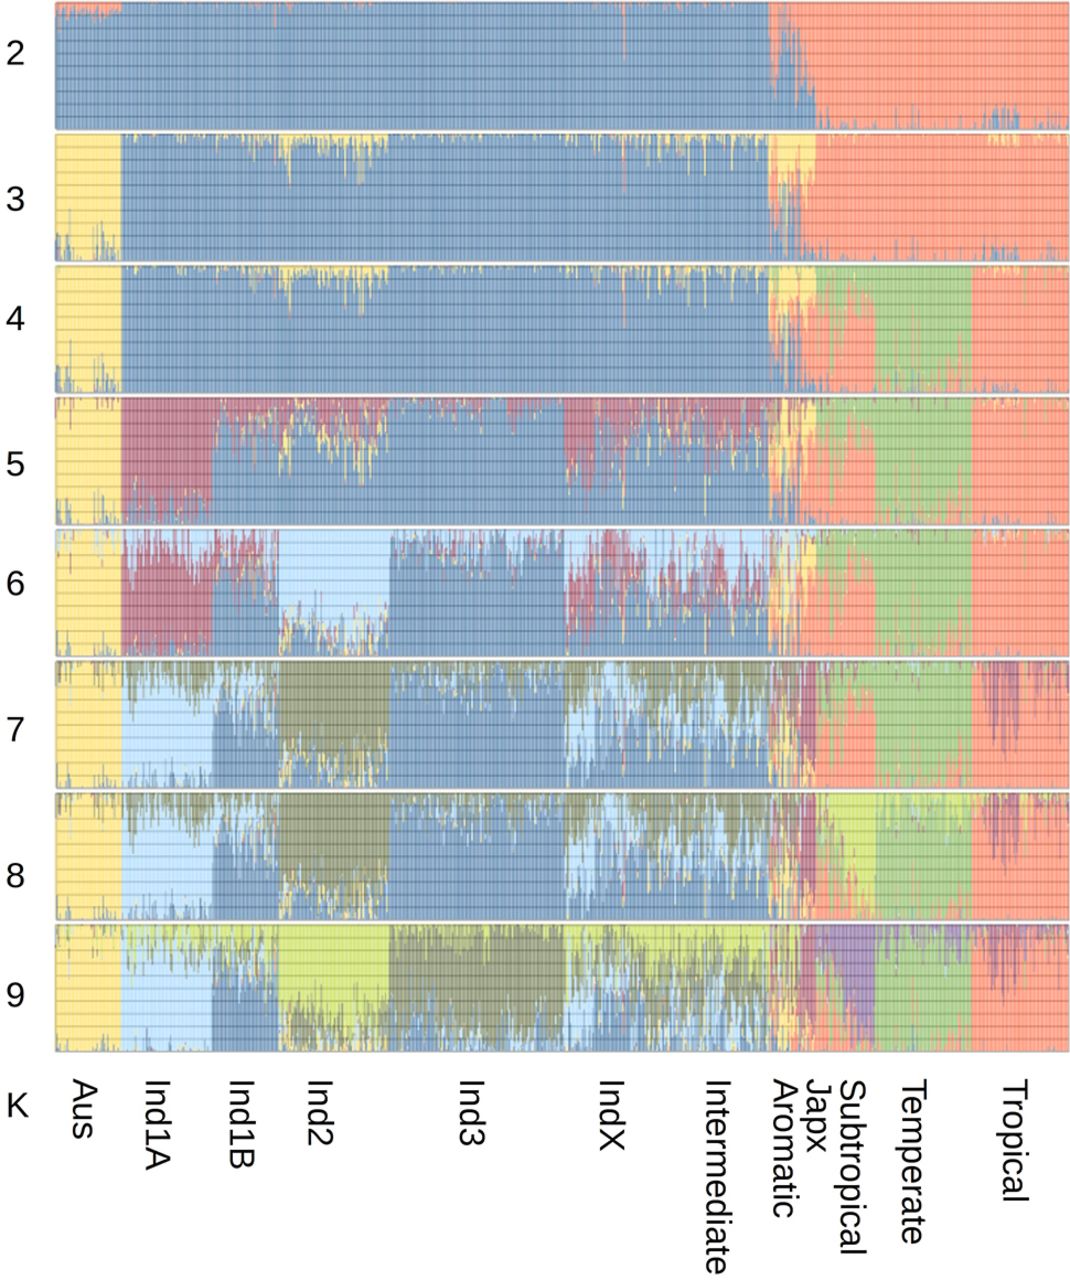
Figure 2.
Structure analysis based on selected CNVs and assuming
K
= [2, …, 9] subpopulations.