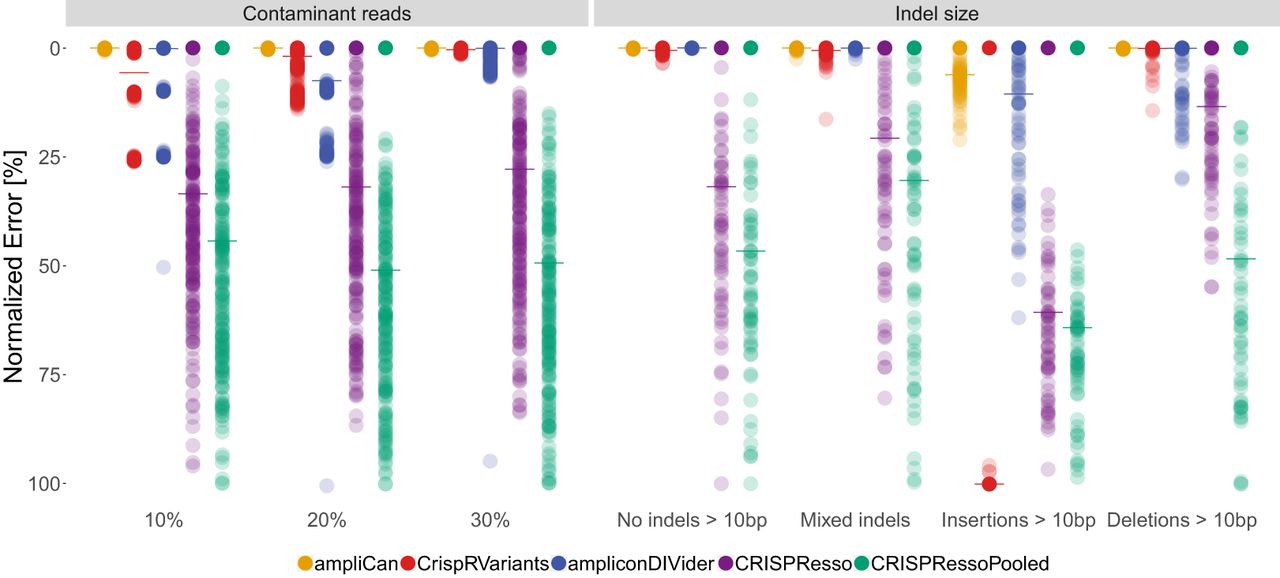
Benchmark of leading tools when estimating mutation efficiency under different data set conditions. Each dot shows the error of the estimate to the correct value for a single experiment normalized to a 0–100 scale. The median performance (mixed indels) is indicated by the horizontal line. The left panel shows comparison of tools when data sets contain contaminant reads (see text and Methods). The x-axis denotes how dissimilar the contaminant reads are to the correct reads. In cases in which the contaminants are from homologous regions, this may be low (10%); for other contaminants, this is likely to be higher (30%). The right panel shows performance of tools as a function of the length of indel events. The sets in the first column contain no indels >10 bp; the second column (Mixed indels) contains a mix of shorter and longer events; the sets in the third and fourth columns contain insertions and deletions >10 bp, respectively.