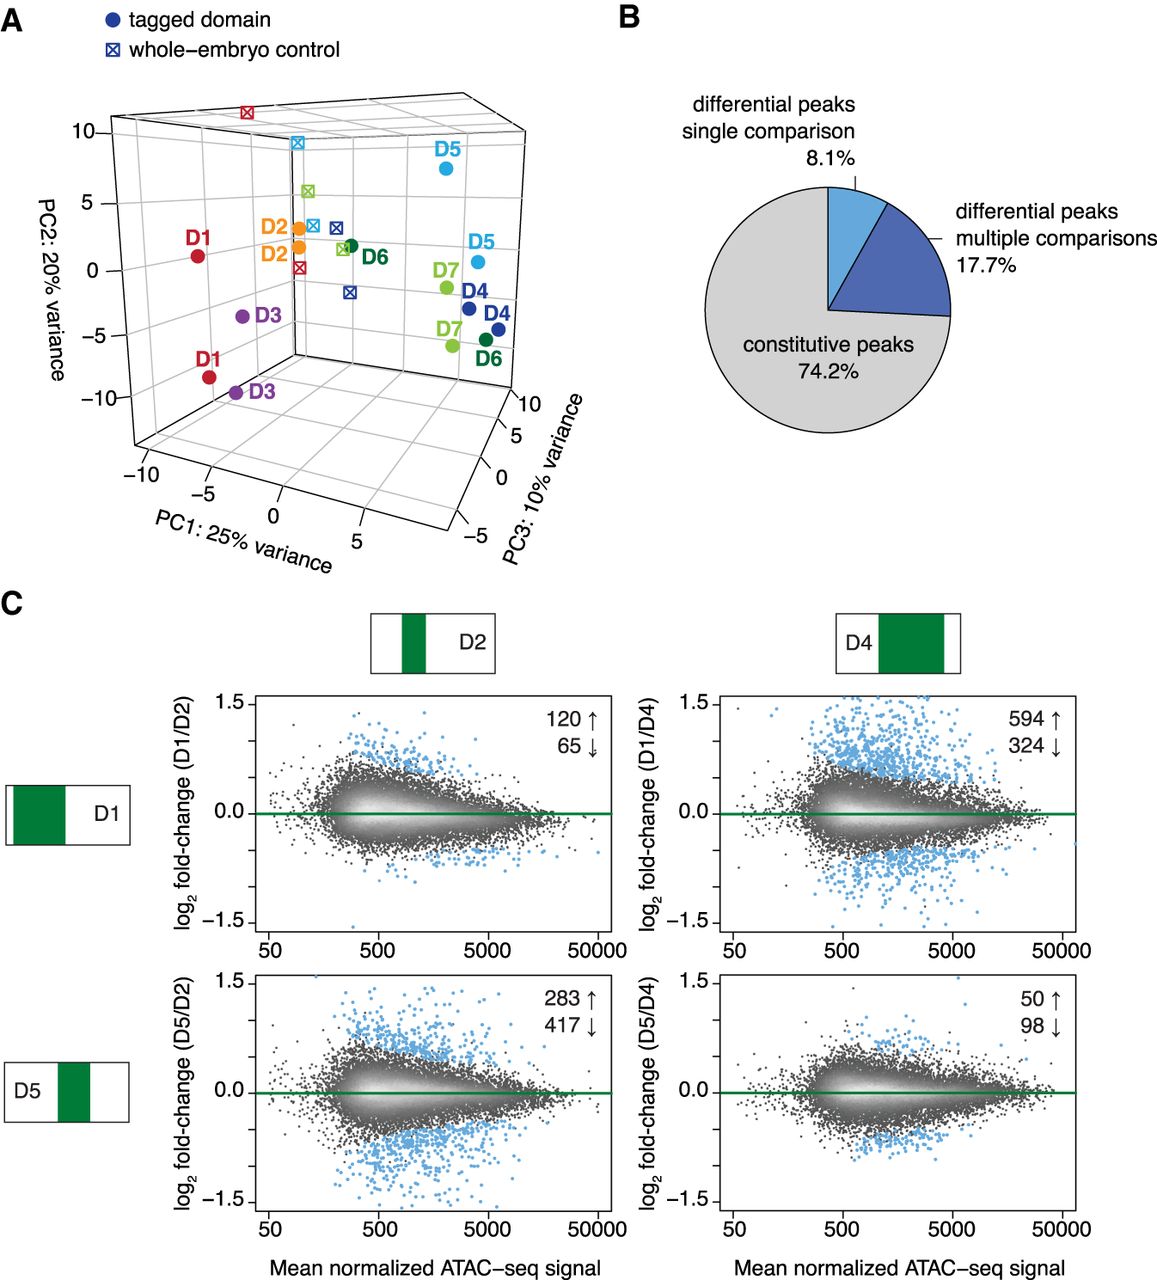
Genome-wide differences in chromatin accessibility profiles along the AP axis. (A) Principal component analysis (PCA) of genome-wide accessibility variation across individual tagged domains (solid circles) and whole-embryo controls (crossed squares). Duplicates are represented as separate data points and color-coded by genotype (D1: red; D2: orange; D3: purple; D4: dark blue; D5: light blue; D6: dark green; D7: light green). PCA is based on accessibility signal (total count of Tn5 transposase cuts) over 17,345 high-confidence ATAC-seq peaks. One replicate of the D6 domain shows high similarity to whole-embryo controls, indicative of potential sample contamination with untagged nuclei. (B) Pie chart shows proportion of the accessible genome (combined size of high-confidence ATAC-seq peaks) represented by constitutive peaks that show no significant variation in their accessibility signal along the AP axis (gray), and differential peaks that are supported by a single pair-wise comparison (light blue) and multiple pair-wise comparisons (dark blue) in the DESeq2 analysis. (C) Example scatter plots show fold-change of ATAC-seq signal between selected domains against the mean normalized signal intensity. Gray: distribution of constitutive peaks, blue points: individual differential peaks (false discovery rate, FDR < 1%). The number of ATAC-seq peaks showing significant increase (up arrow) and decrease (down arrow) of their signal is indicated in the upper right corner of each plot.