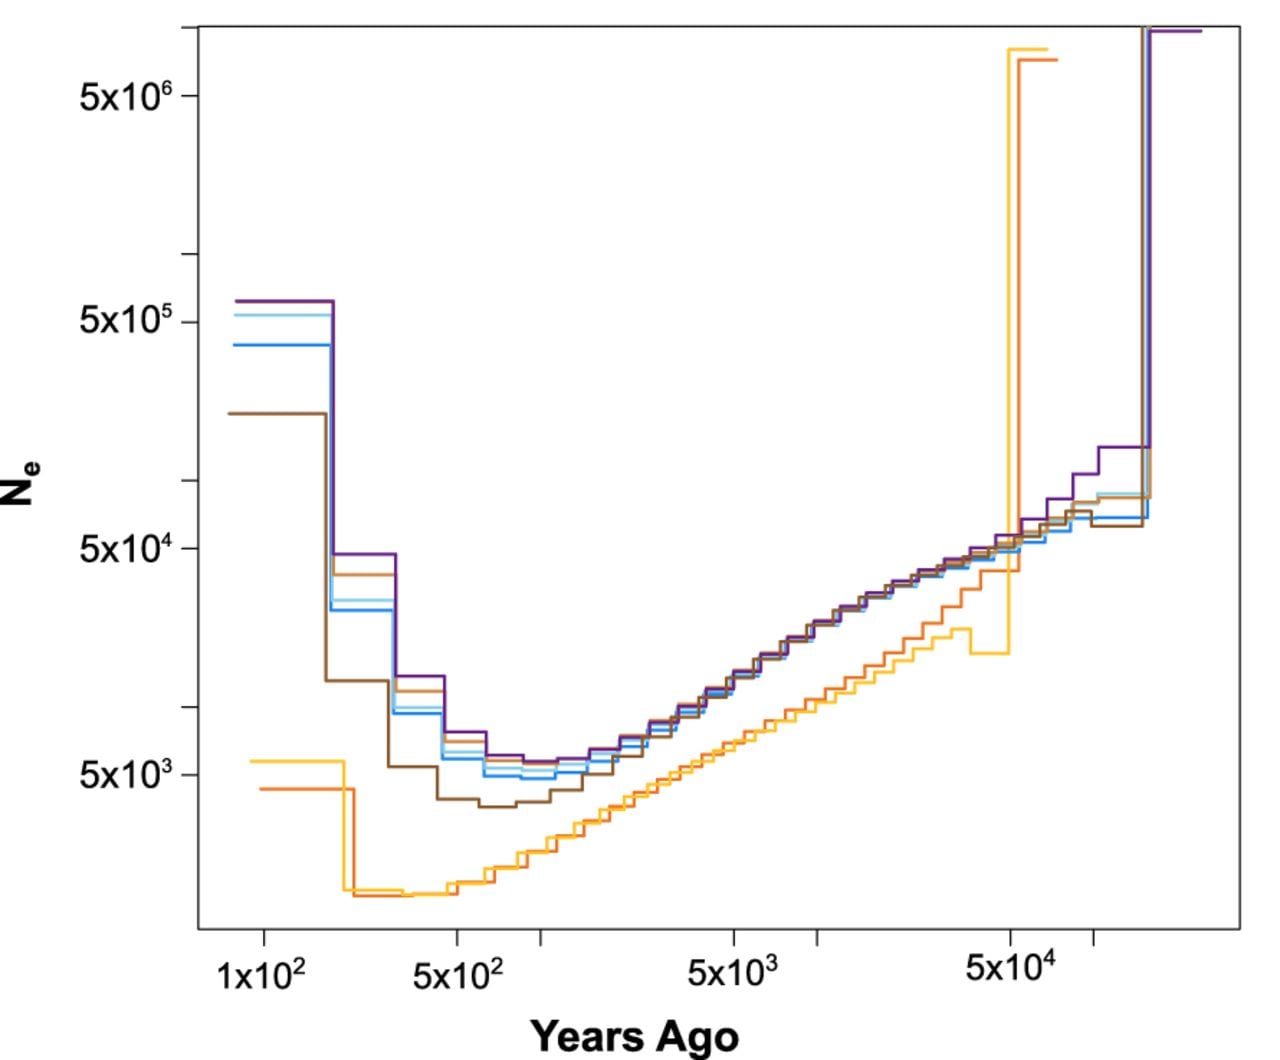
Figure 2.
Plot of change in effective population size (Ne) over time using MSMC2, where the x-axis is years before the present. Each evolutionary cluster was represented by a different color: eastern China, dark brown; SE Asia, light brown; Aleutian, orange; Western North America, yellow; Northern Europe, purple; Western Europe, light blue; and Expansion, medium blue.