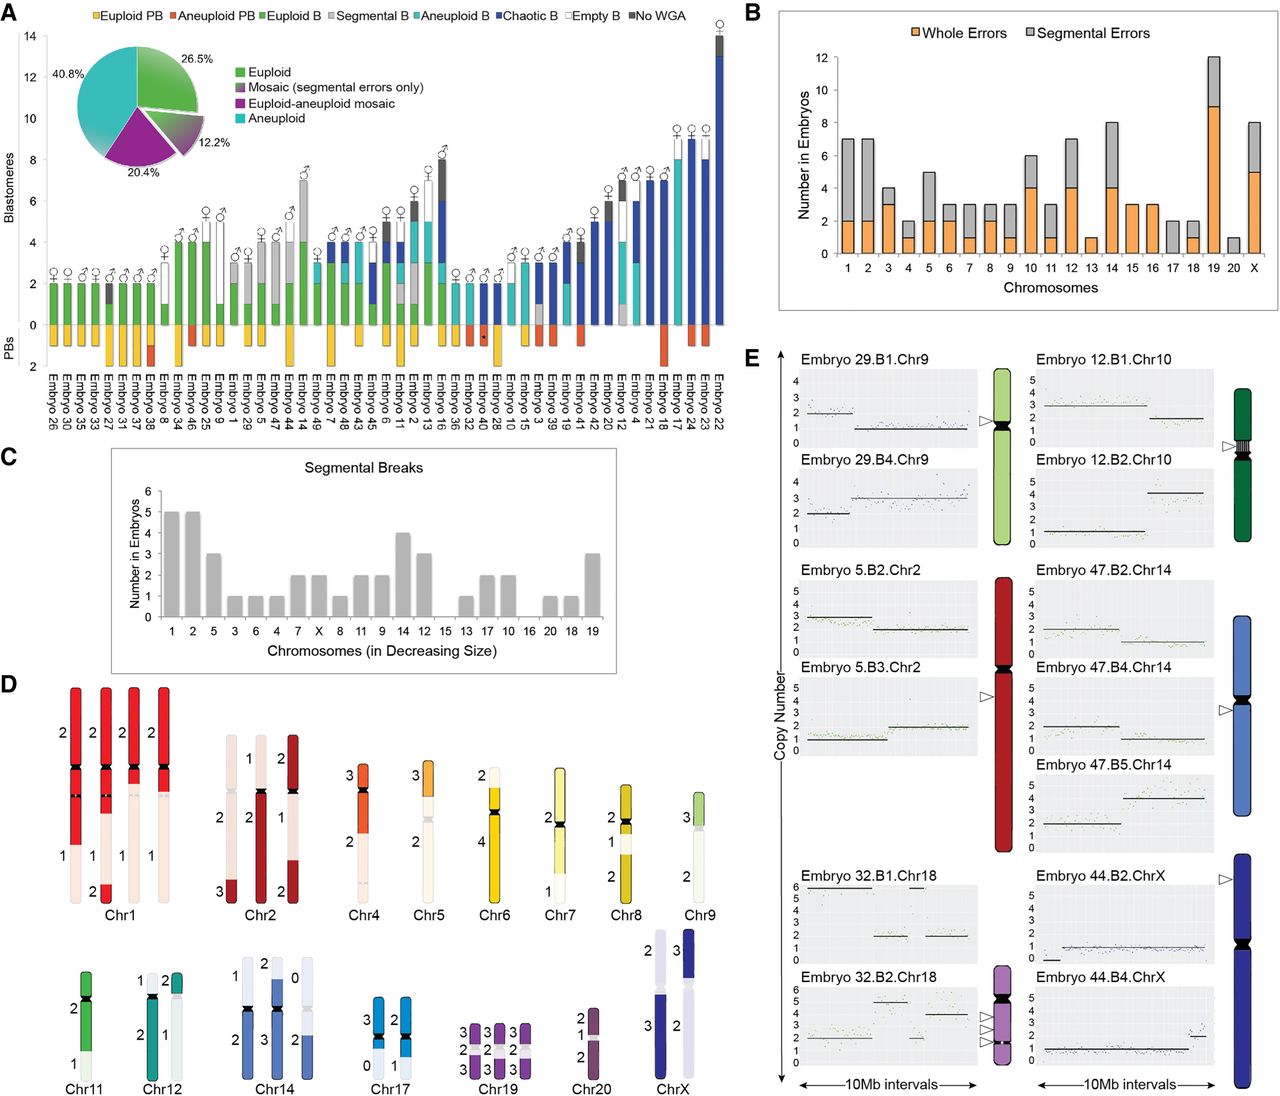
Assessment of whole and subchromosomal instability in rhesus embryos. (A) CNV summary of rhesus embryos (N = 49) from the two- to 14-cell stage analyzed by scDNA-seq. Stacked bars represent euploid (yellow) and aneuploid (orange) polar bodies (PB); euploid (green), aneuploid (light blue), segmental aneuploid-only (light gray), and chaotic aneuploid (dark blue) blastomeres (B); no WGA (dark gray); and empty blastomeres (white) detectable by high mitochondrial (mtDNA) but no genomic DNA reads (N = 296 samples). Aneuploid PB containing only segmental errors labeled with asterisk. (♂) Chr Y present; (♀) two Chr X present. Percentage of euploid, aneuploid, or mosaic embryos with or without solely segmental errors is shown in the pie chart (upper left). (B) Number of times chromosomes were affected by whole (orange) or segmental (gray) losses or gains. (C) Graph showing that there was no significant association (P-value = 0.1475) between the number of segmental breaks and chromosome size (Spearman's correlation = 0.3273). (D) Location of chromosomal breaks in embryos with segmental aneuploidy. Numbers to the left represent the copy number state of blastomeres. (E) CNV plots of six embryos, in which chromosomal breakage resulted in a reciprocal loss and gain of chromosome segments between blastomeres (left). Chromosome ideograms showing the approximate breakpoint locations (right; white arrowheads) of each embryo with reciprocal breaks. Vertical lines in Chr 10 delineate the nucleolus organizer region adjacent to the centromere (black), and the gray circle in Chr 18 designates the ancestral inactivated centromere.