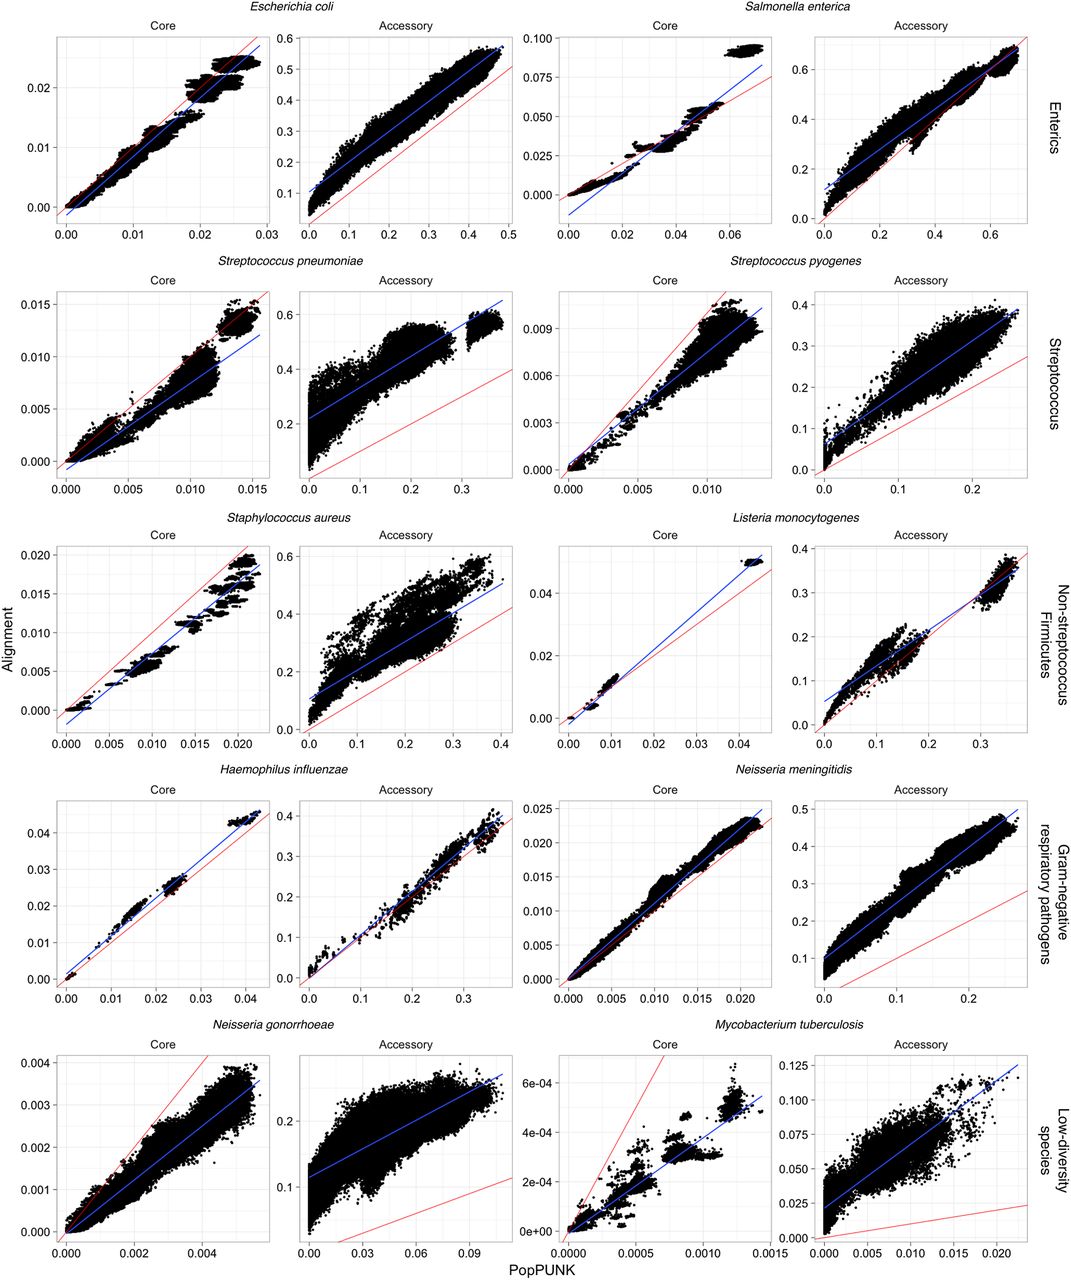
Figure 3.
Comparison of core and accessory distances from PopPUNK (x-axis) and pan-genome construction with Roary (y-axis). For each species, the core distance was calculated as the Tamura-Nei (tn93) distance from the core genome alignment; the accessory distance was calculated as the Jaccard distance between binary strings representing gene presence/absence. In each panel, the line of identity (red line) and a linear regression (blue line) are also plotted. Sketch sizes were 104, except for M. tuberculosis which used a sketch size of 105.