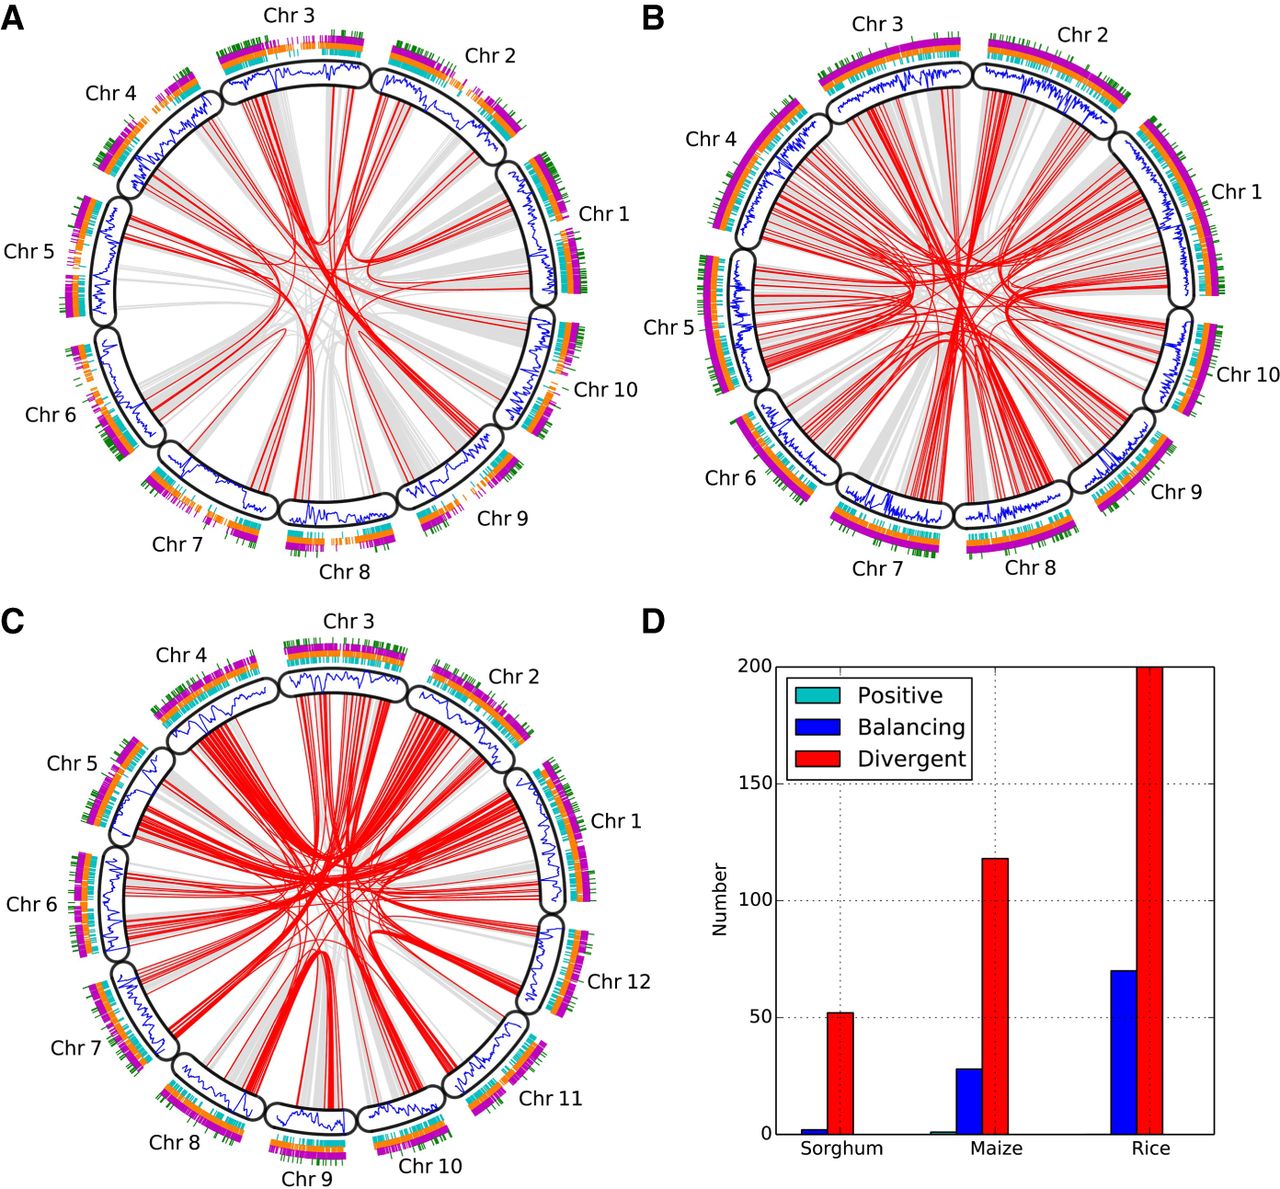
Genetic diversity of syntenic gene pairs. Syntenic genes pairs that show different genetic diversity (difference of Tajima's D > 3) are connected by red lines. Blue lines show genomic distribution of Tajima's D across each chromosome. A sliding window method is used with window size of 1 Mb and step size of 100 kb. The short lines outside each circle mark the genomic position of the following types of genes (from inside to outside): tandemly duplicated (cyan); transposed duplications (orange); species-specific duplications (magenta); and singleton (green). (A) Sorghum; (B) maize; (C) rice. (D) Number of syntenic gene pairs with different selection patterns. “Positive”: both syntenic genes showing recent positive selection indicated by significant negative Tajima's D. “Balancing”: both syntenic genes showing balancing selection indicated by significant positive Tajima's D. “Divergence”: syntenic gene pairs showing different selection patterns as indicated by the red lines in the circle plot.