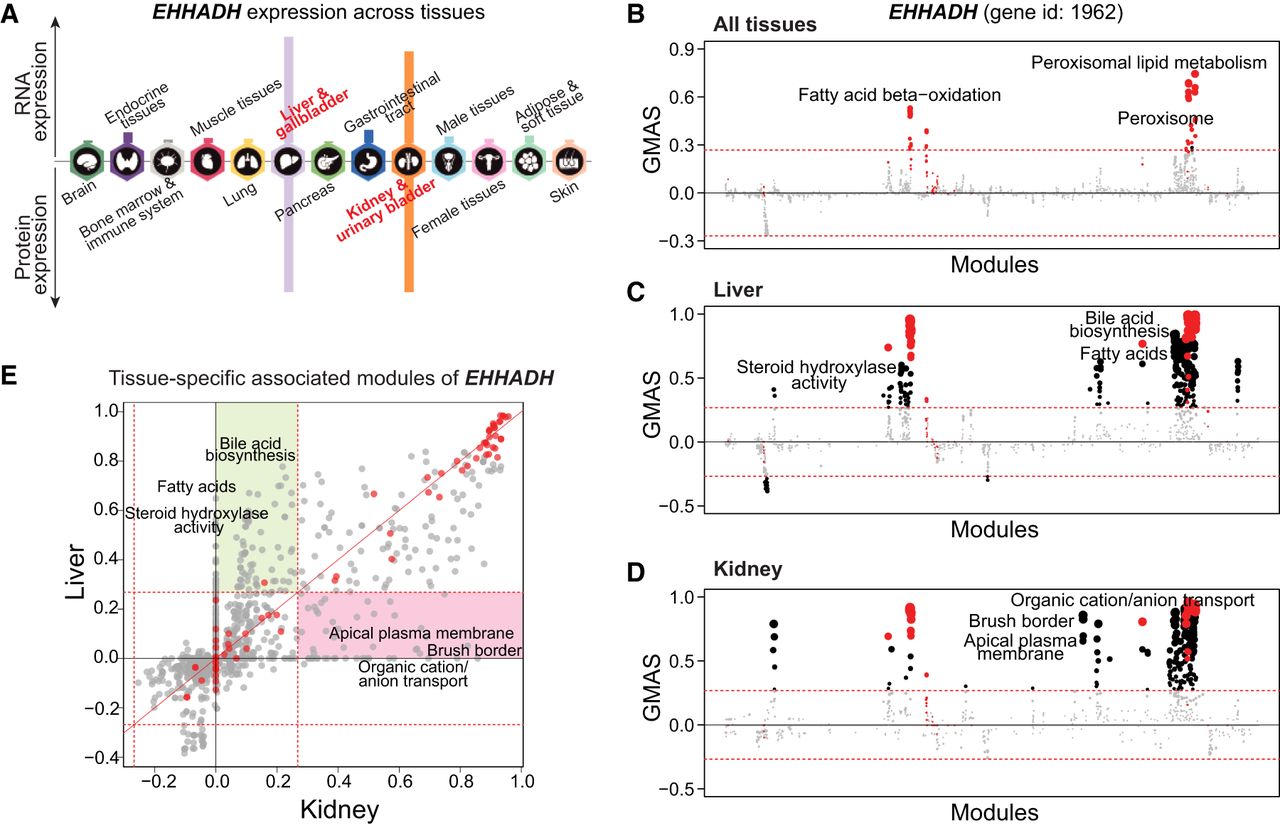
G-MAD identifies tissue-specific associated modules for EHHADH by using data sets from different tissues. (A) Expression patterns of EHHADH across tissues. The figure was adapted from the Human Protein Atlas (www.proteinatlas.org/). (B–D) G-MAD of EHHADH in human using data sets from all tissues (B), from liver (C), or from kidney (D). The threshold of significant gene-module association is indicated by the red dashed line. Modules are organized by their similarities. Known modules connected to EHHADH from gene annotations are shown in red dots and other modules with GMAS over the threshold are shown by black dots. (E) Comparison of G-MAD results of EHHADH in liver and kidney. Known modules connected to EHHADH are shown in red dots. The threshold of significant gene-module association is indicated by the red dashed line. Modules significantly associated with EHHADH only in one specific tissue are highlighted. The comparison of the association results of EHHADH in liver and kidney can be found in Supplemental Table S3.