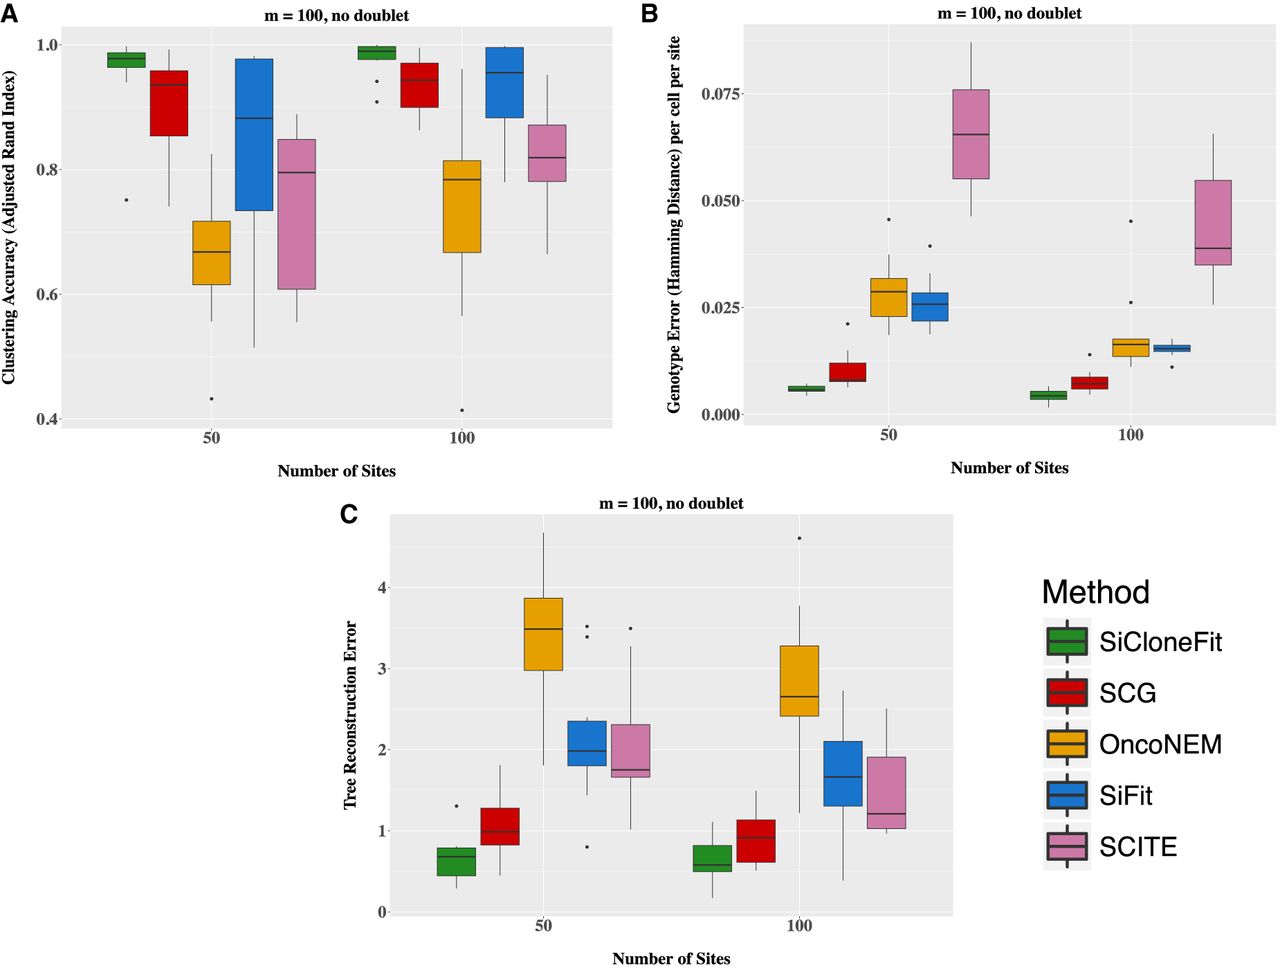
Performance comparison on simulated data sets containing 100 cells. SiCloneFit's performance is compared against that of SCG, OncoNEM, SiFit, and SCITE on simulated data sets containing 100 cells for varying numbers of sites. On the x-axis, we have results corresponding to n = 50 and n = 100. The cells were sampled from K = 10 clonal populations. Each box plot summarizes results for 10 simulated data sets with varying clonal phylogeny and varying size of clonal clusters. (A) Comparison of clustering accuracy measured in terms of Adjusted Rand Index that compares the inferred clustering against the ground truth. (B) Comparison based on the genotyping error measured in terms of Hamming distance per cell per site between the true genotype matrix and inferred genotype matrix. (C) Comparison based on the tree reconstruction error measured in terms of pairwise cell shortest-path distance between the true clonal phylogeny and inferred clonal phylogeny.