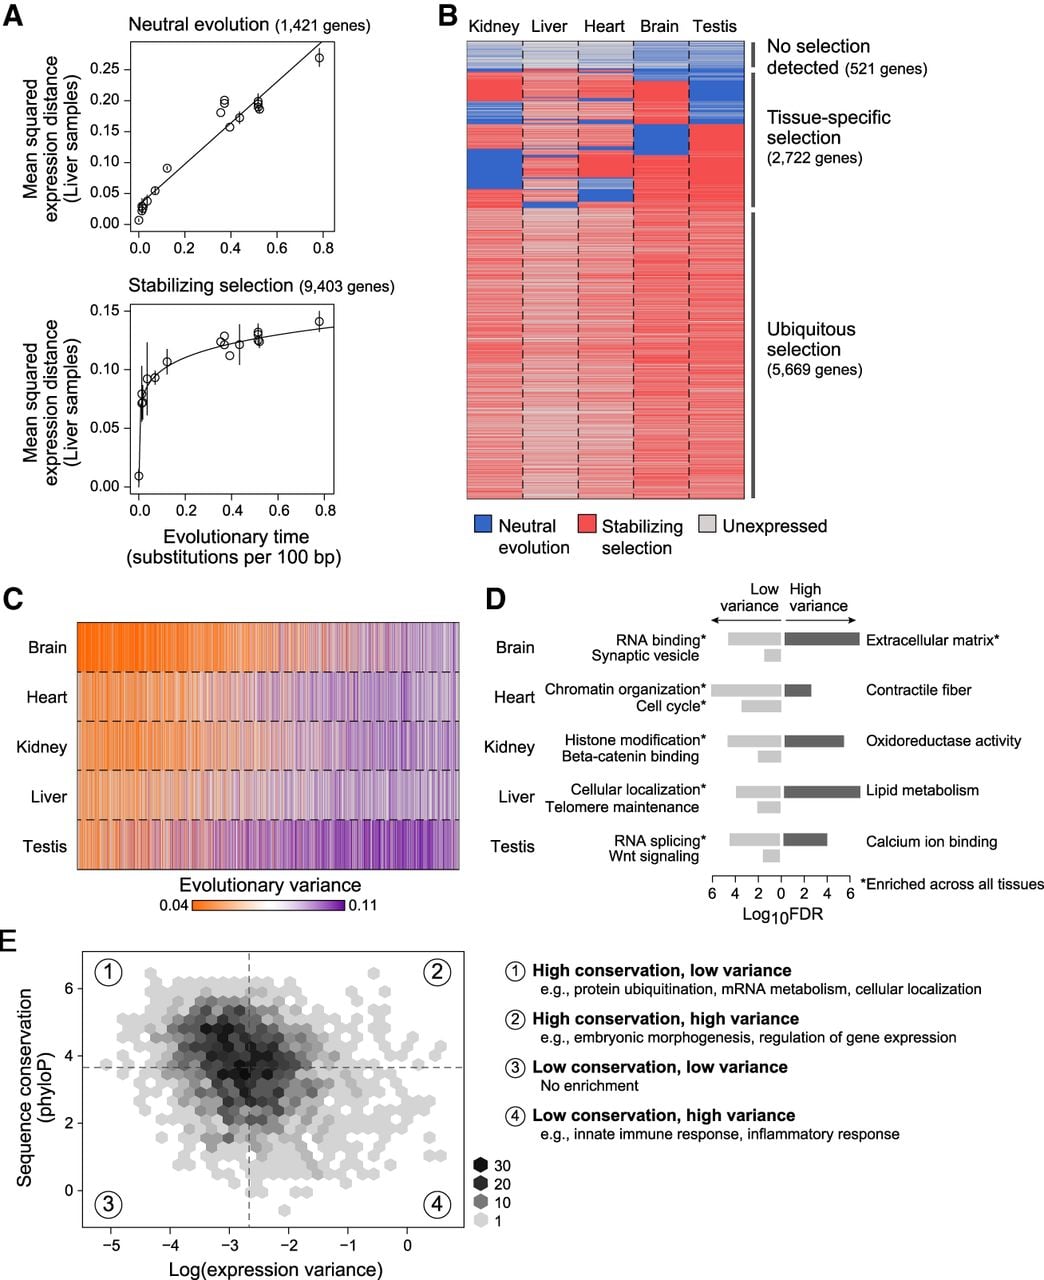
Quantification of neutral and constrained selection on gene expression using the OU model parameters. (A) Detection of stabilizing selection. Pairwise mean squared expression distances (y-axis) between mammals and human for liver samples across evolutionary time (x-axis) for genes whose expression evolution fits better under a Brownian motion (BM) process (top), indicating neutral evolution, and genes whose expression evolution fits better an Ornstein–Uhlenbeck (OU) process (bottom), indicating the presence of stabilizing selection: (solids lines) linear regression fit for BM genes and nonlinear regression fit for OU genes. (B) Neutral and stabilizing selection across genes and tissues. Heatmap indicating genes (rows) whose expression is predicted to be evolving under neutral evolution (blue) or stabilizing selection (red) across five different tissues (columns); (gray) genes that are expressed <5 TPM. (C,D) Evolutionary variance across tissues and processes. (C) Heatmap shows estimated evolutionary variance of expression (orange: low; purple: high) across genes (columns) in five tissues (rows); (gray) genes expressed <5 TPM. (D) Bar plot of −log10 FDR values for significantly enriched GO categories of low (light gray) and high (dark gray) variance genes within each tissue; (*) category enriched in every tissue. (E) Relationship between sequence and expression evolution. Binned scatter plot of log(evolutionary variance) of liver expression (x-axis) versus sequence conservation, as measured by the phyloP score (y-axis). Median variance and phyloP scores are indicated by vertical and horizontal dotted lines, respectively. Enriched GO categories (FDR <0.001) for genes in each quadrant of the scatter plot are listed on the right.