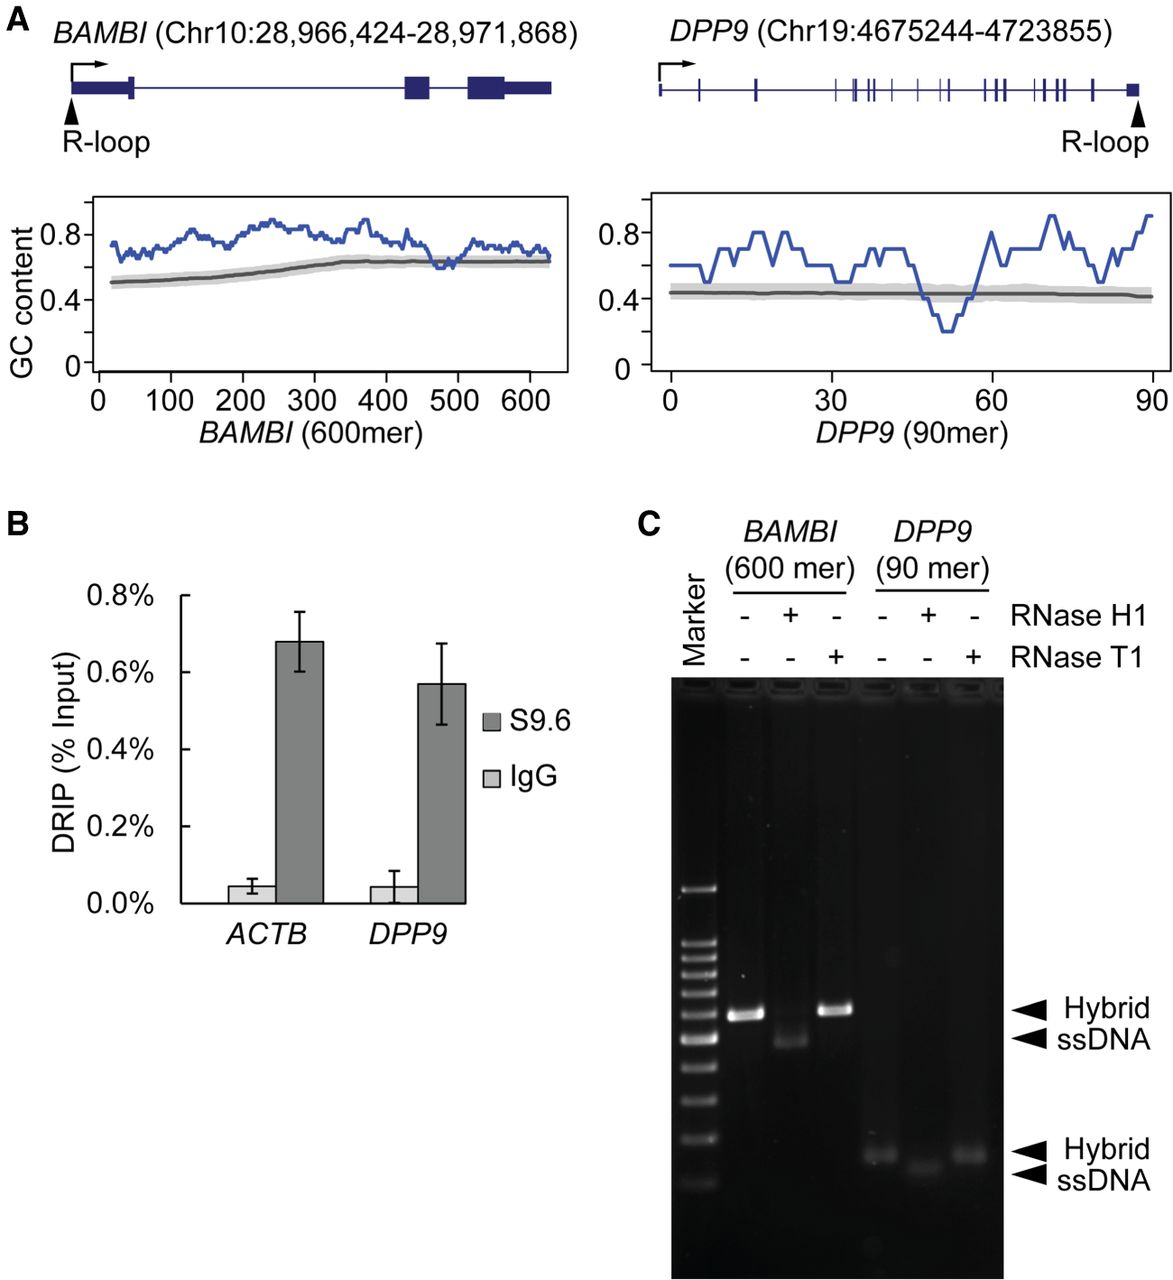
R-loops at GC-rich regions in the BAMBI promoter and DPP9 3′ UTR. (A) Location and GC content of sequences underlying R-loops in BAMBI and DPP9. (Top) R-loop location is marked on gene models of BAMBI and DPP9. Boxes represent exons, and lines represent introns. Arrows show transcription start site and direction of transcription. (Bottom) GC content of the 600-mer and 90-mer sequences corresponding to RNA sequence in the R-loops (blue line). GC content is calculated as (G + C)/(G + C + A + U) in the 50-nt sliding window for 600-mer or 10-nt sliding window for 90-mer. Genome background of GC content is calculated from corresponding regions of 14,587 RefSeq genes that are at least 2 kb long and 1 kb away from neighboring genes. The gray line represents median GC content, and the shade represents ±10%. (B) The S9.6 antibody specifically pulled down R-loops at the 3′ UTR of DPP9. DRIP was carried out using an S9.6 antibody or nonspecific IgG. Precipitated DNA was amplified using primers specific for DPP9 3′ UTR. Primers specific for a previously reported R-loop region at the 3′ UTR of ACTB were used as positive control. (Error bars) SEM of triplicates. (C) Integrity of the RNA/DNA hybrid was confirmed using RNase H1 and RNase T1. As expected, RNase H1 specifically digested RNA in the hybrids, leaving ssDNA as a product. RNase T1, which is specific for ssRNA, did not cleave the hybrids.