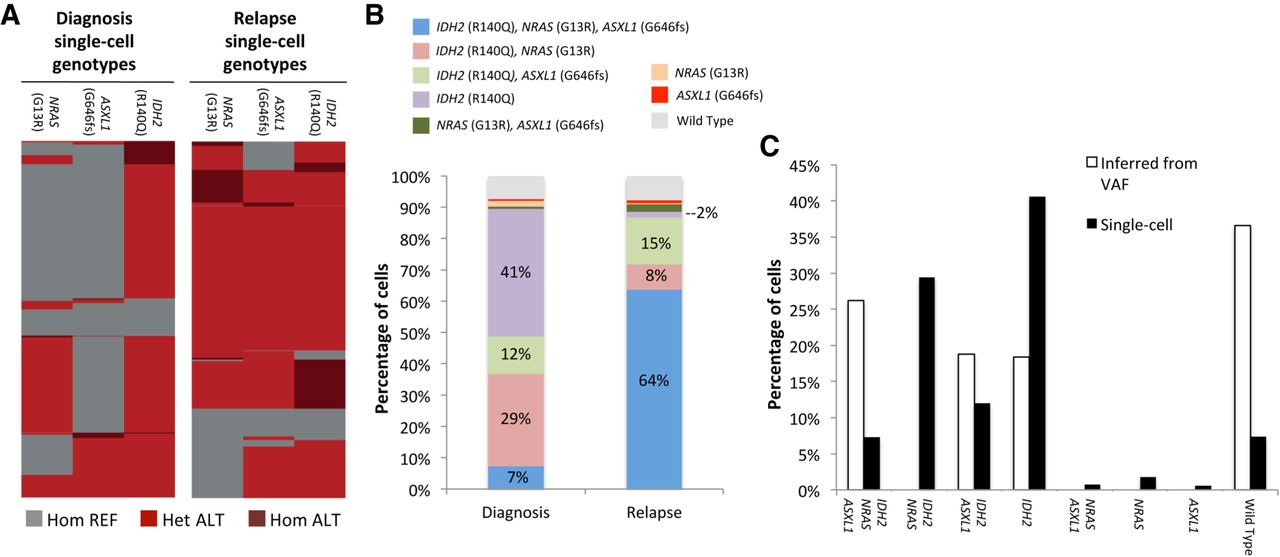
Clonal remodeling of an AML tumor. (A) Heat maps denoting single-cell genotypes for the diagnosis and relapse samples. The presence of a heterozygous alternate (ALT) allele is shown in red. Homozygous alternate alleles are shown in dark red, and reference alleles are depicted in gray. (B) Clinical bone marrow biopsies taken at the time of diagnosis and relapse show substantial changes in clonal distribution with single-cell sequencing. Wild type indicates cells that had reference genome sequence for IDH2, ASXL1, and NRAS. (C) Comparison of single-cell sequencing data from the diagnosis sample obtained from our workflow and a simple clonal inference of the diagnosis cell populations produced from the bulk VAFs. Nonpatient Raji cells have been removed from these data sets.