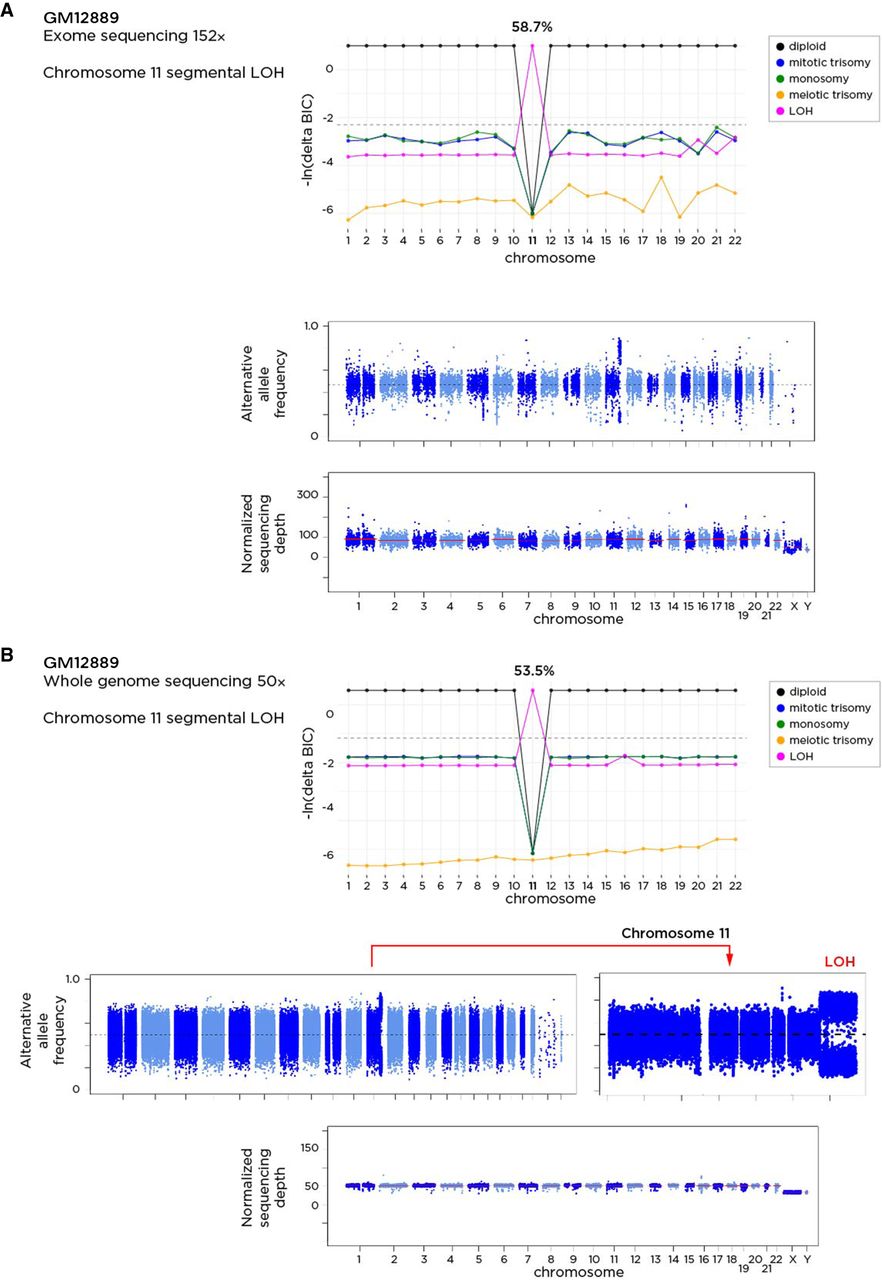
The GM12889 sample has been tested using exome sequencing as part of the 1000 Genomes study (A) and using whole-genome sequencing to mean 50× coverage (B). The application of the MADSEQ approach shows the predictions for each chromosome and the differences in Bayesian information criterion for each model. The top plot within each panel shows these BIC values for each model on the y-axis for each chromosome (x-axis). The horizontal dashed line represents our threshold difference for discriminating between models. In A, we see that a cnnLOH model for Chromosome 11 is strongly predicted, occurring in 58.7% of cells. Whole-genome sequencing data from the same DNA shows a highly concordant prediction of mosaicism for segmental cnnLOH in the same region of distal Chromosome 11 (bottom) in 53.5% of cells.