Figure 1.
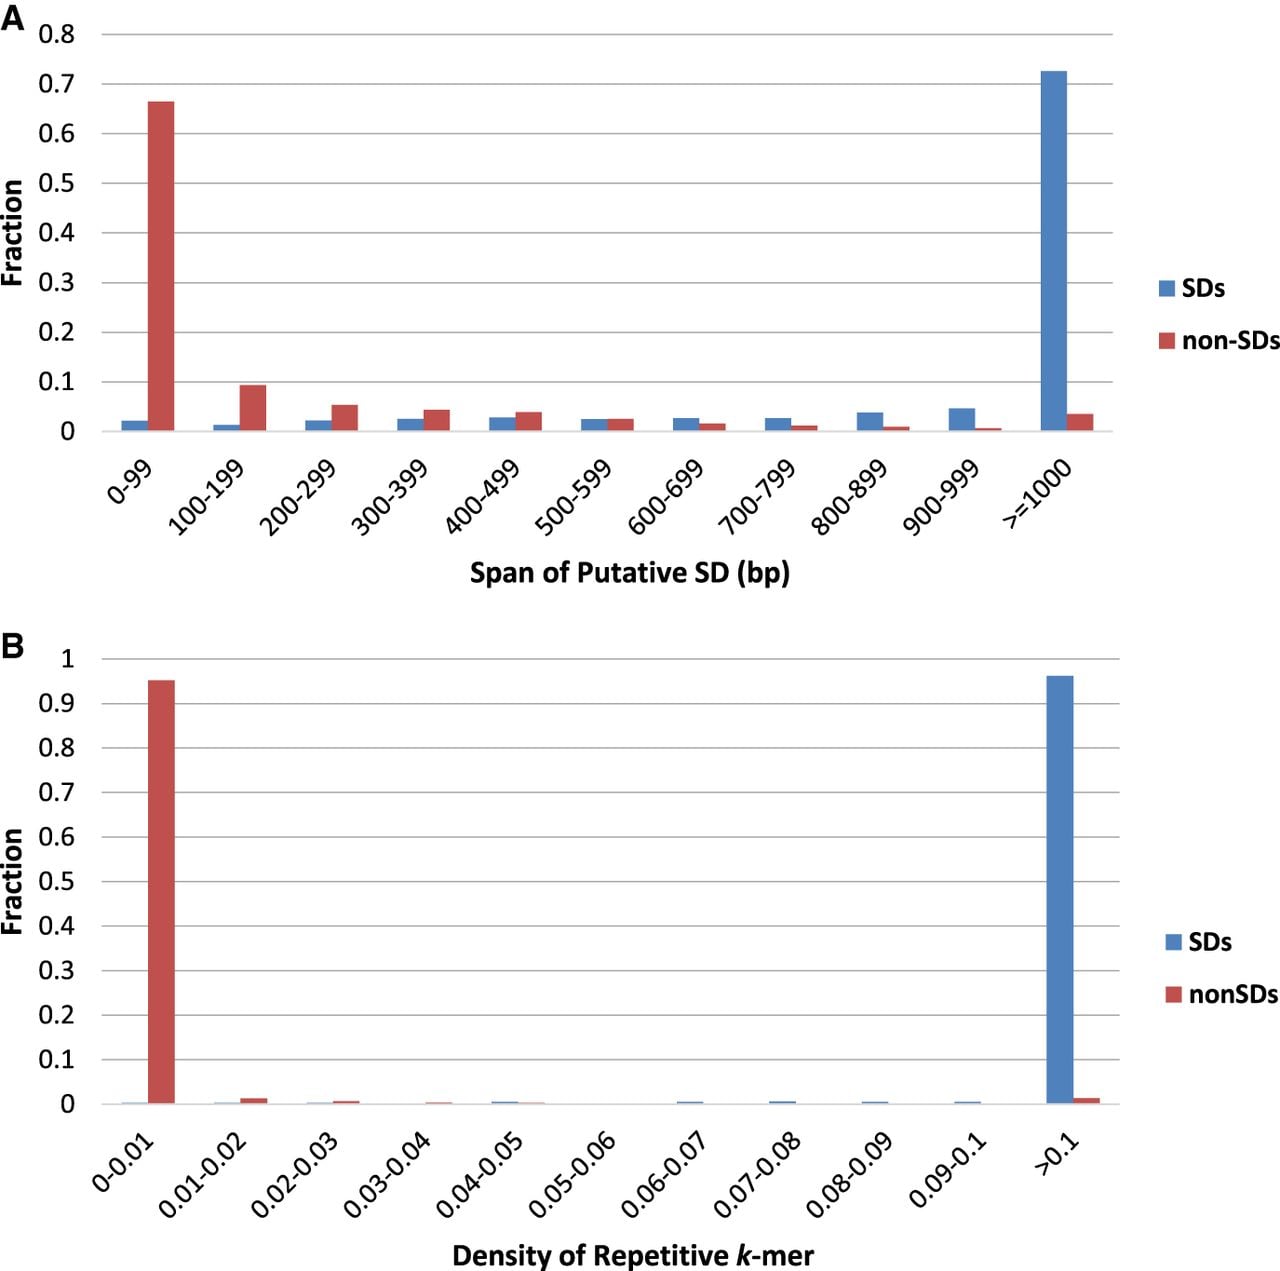
The distribution of the span (A) and density (B) of putative SDs in known SDs (blue) and non-SDs (red) in the hg19 assembly of the human genome.
The distribution of the span (A) and density (B) of putative SDs in known SDs (blue) and non-SDs (red) in the hg19 assembly of the human genome.