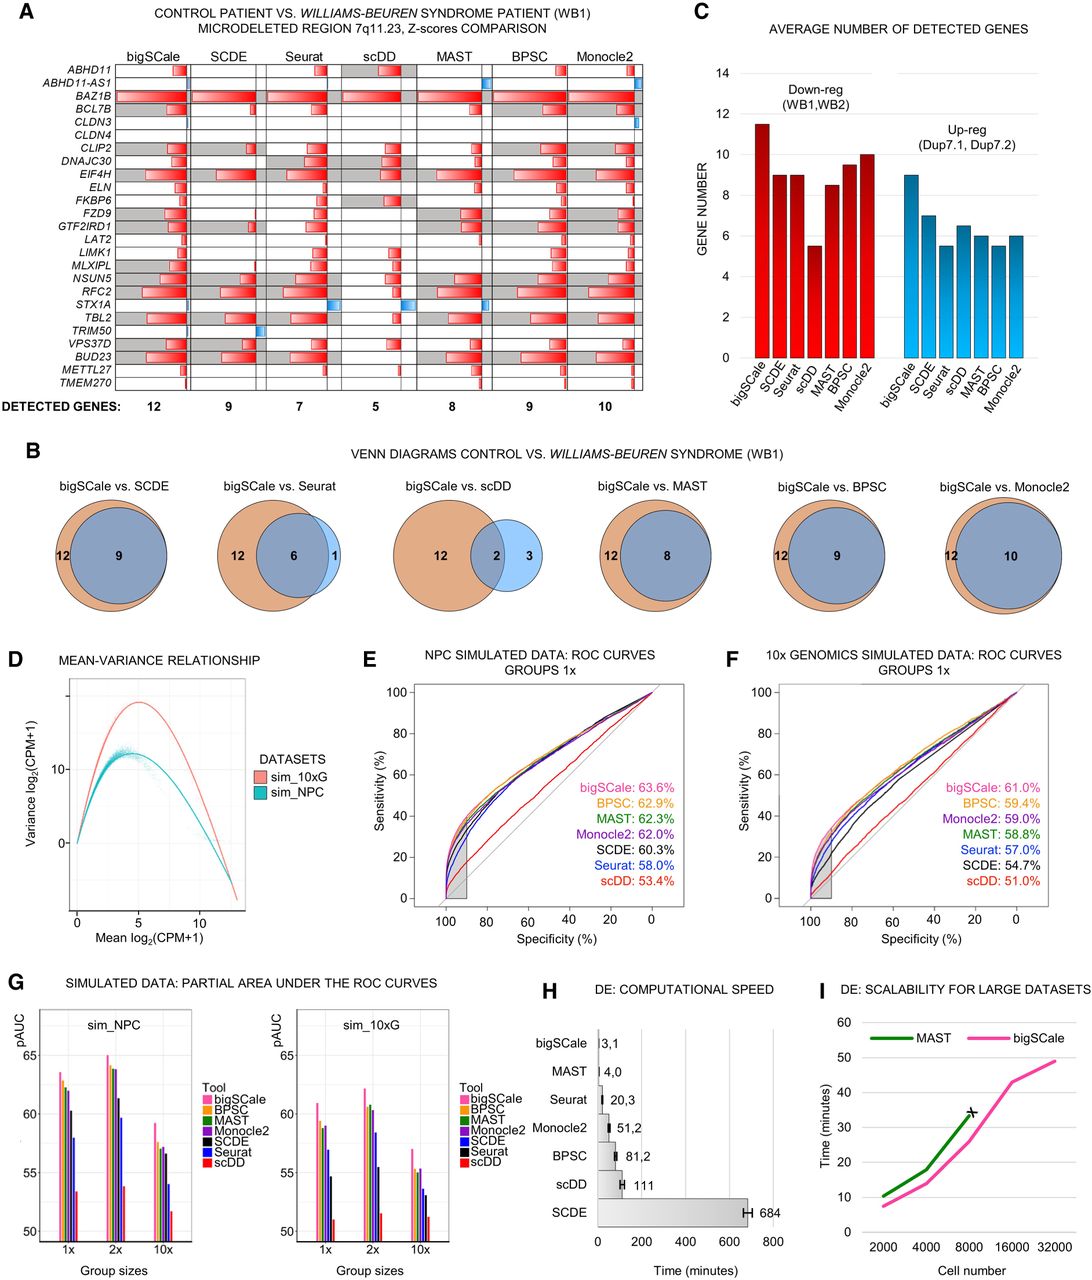
Benchmarking of sensitivity, specificity, and speed of bigSCale, SCDE, Seurat, MAST, scDD, BPSC, and Monocle2. (A) DE analysis in iPS cell–derived neuronal progenitor cells (NPCs) from healthy and Williams-Beuren (WB) syndrome donors (WT vs. WB1). For the genes located in the deleted region, the P-values of each tool are shown in Z-score scale. (Red) Down-regulated; (blue) up-regulated. Genes correctly detected as down-regulated are highlighted (gray). Total numbers of correctly assigned genes are indicated (below). (B) Venn diagrams for WT versus WB1 comparing the identity of correctly assigned genes. (Orange) bigSCale; (blue) others. (C) Average number of detected down-regulated (red) and up-regulated (blue) genes in the two WB and Dup7 patients, respectively, compared with a healthy donor. (D) Comparison of the mean-variance relationship in the two simulated data sets (sim_NPC and sim_10×). (E,F) Partial AUCs of ROC curves computed across the tools in the two simulated data sets (sim_NPC, E; sim_10×, F) with group sizes having proportions 1:1 (1×). The sensitivity at high level of specificity (>90%) is highlighted (gray area). (G) Barplots of partial AUC across tools for all tested proportions (1×, 2×, 10×) in DE analysis of simulated data sets (sim_NPC and sim_10×). (H) Average required time for computing DE in the NPC cell model (average 739 total cells per comparison, four comparisons, tools run on one CPU-core). (I) Scalability of bigSCale and MAST with large data sets. MAST could not be tested beyond 8000 cells due to excessive RAM requirements (>16 Gb).