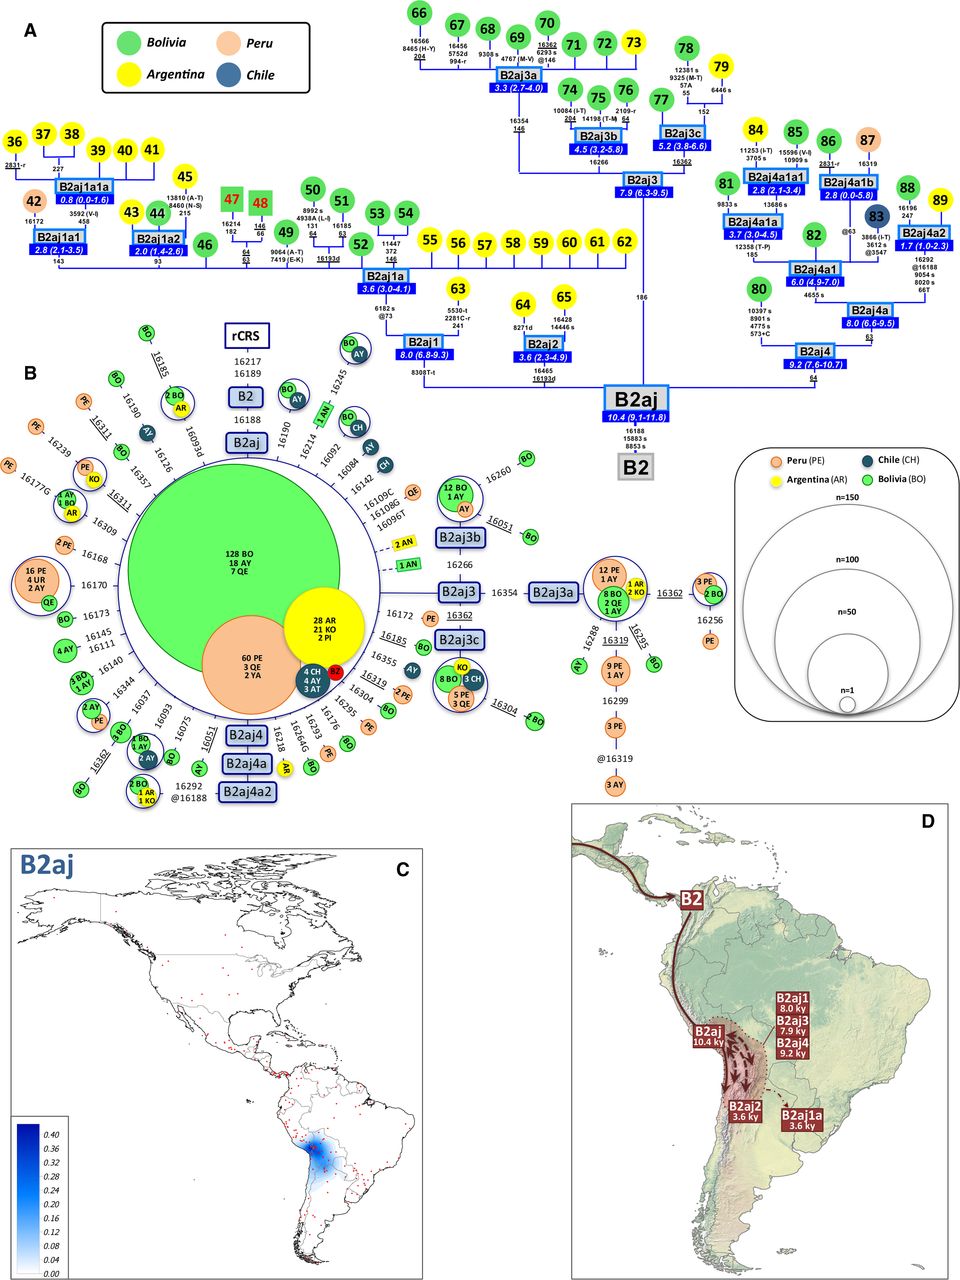
Figure 2.
(A) Maximum parsimony tree of B2aj complete mitogenomes. (B) Network of B2ab CR haplotypes obtained from population surveys (listed in Supplemental Table S2). (C) Interpolated frequencies of B2aj mtDNAs in America. (D) Main migration routes of B2aj as inferred from phylogeographic data. See the legend of Figure 1 for more details on the phylogenies of panels A and B.