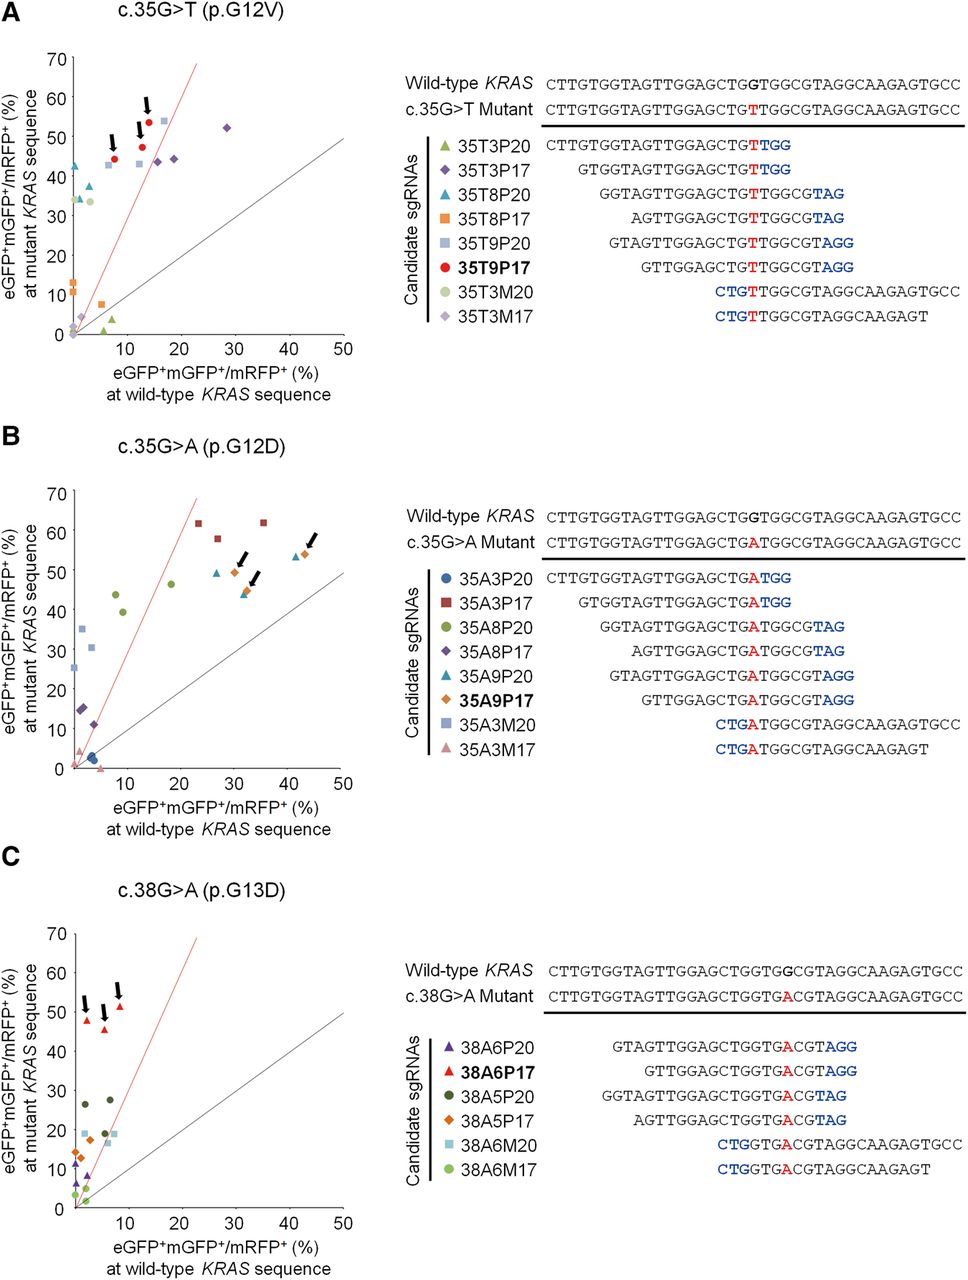
Reporter-based selection of sgRNAs that target mutant KRAS. The ratios of eGFP+mRFP+/eGFP+ cells after transfection of reporters with mutant (c.35G>T [A], c.35G>A [B], or c.38G>A [C]) or wild-type target sequences, which reflect guide RNA activities at the target sequences, are shown on the left in the two-dimensional graphs. Black and red lines in the graphs represent ratios of eGFP+mRFP+/mRFP+ cells for mutant vs. wild-type KRAS target sequences with values of 1 and 3, respectively. The target sequence of each sgRNA is shown on the right side; the KRAS point mutation site is shown in red and the protospacer adjacent motif sequence is in blue. sgRNAs selected for subsequent studies are indicated with black arrows in the two-dimensional graphs and their names are shown in bold.