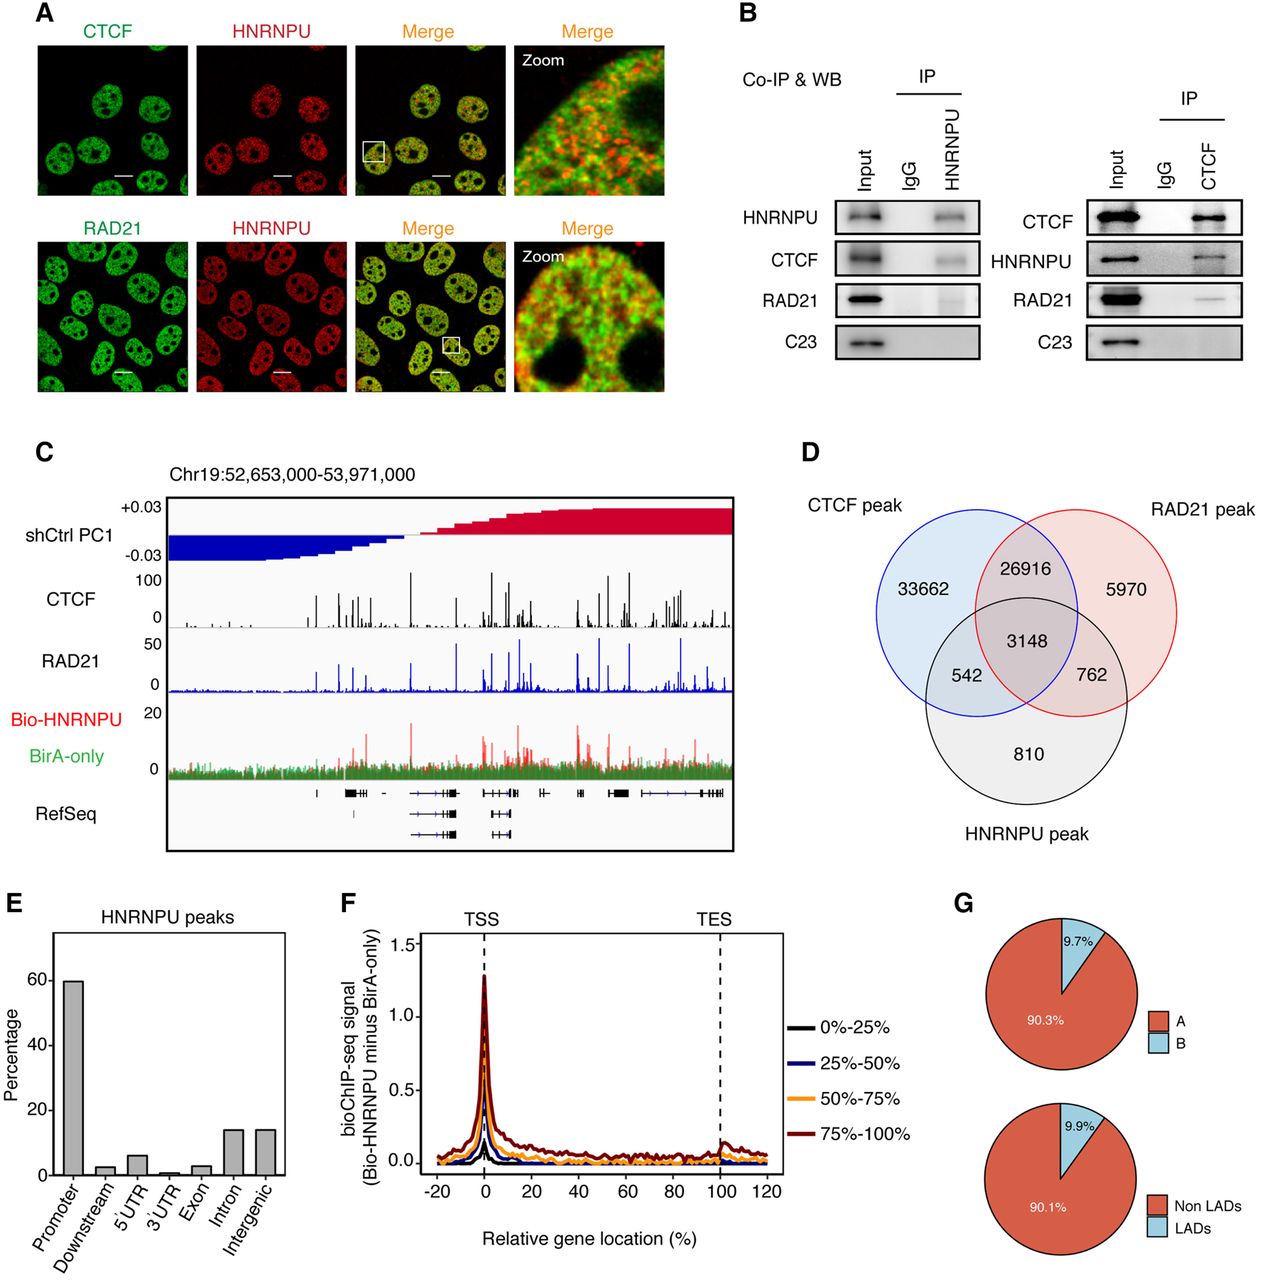
HNRNPU associates with CTCF and RAD21. (A) Immunofluorescent staining displays partial colocalization of HNRNPU (red) and CTCF or RAD21 (green) in AML12 cells. Scale bar, 10 µm. (B) Endogenous co-immunoprecipitation with HNRNPU (left) or CTCF (right) antibodies, and blots with indicated antibodies. (C) ChIP-seq tracks of CTCF and RAD21; bioChIP-seq tracks of HNRNPU and BirA only (negative control) on a 1.3-Mb region on Chromosome 19. (D) Venn diagram showing overlaps between peaks of CTCF, RAD21, and HNRNPU. (E) Distribution of HNRNPU peaks relative to genes. (F) Average profiles of HNRNPU bioChIP-seq signal of genes at different expression levels (100% denotes the highest expression). (G) Distribution of HNRNPU peaks relative to compartments and LADs.