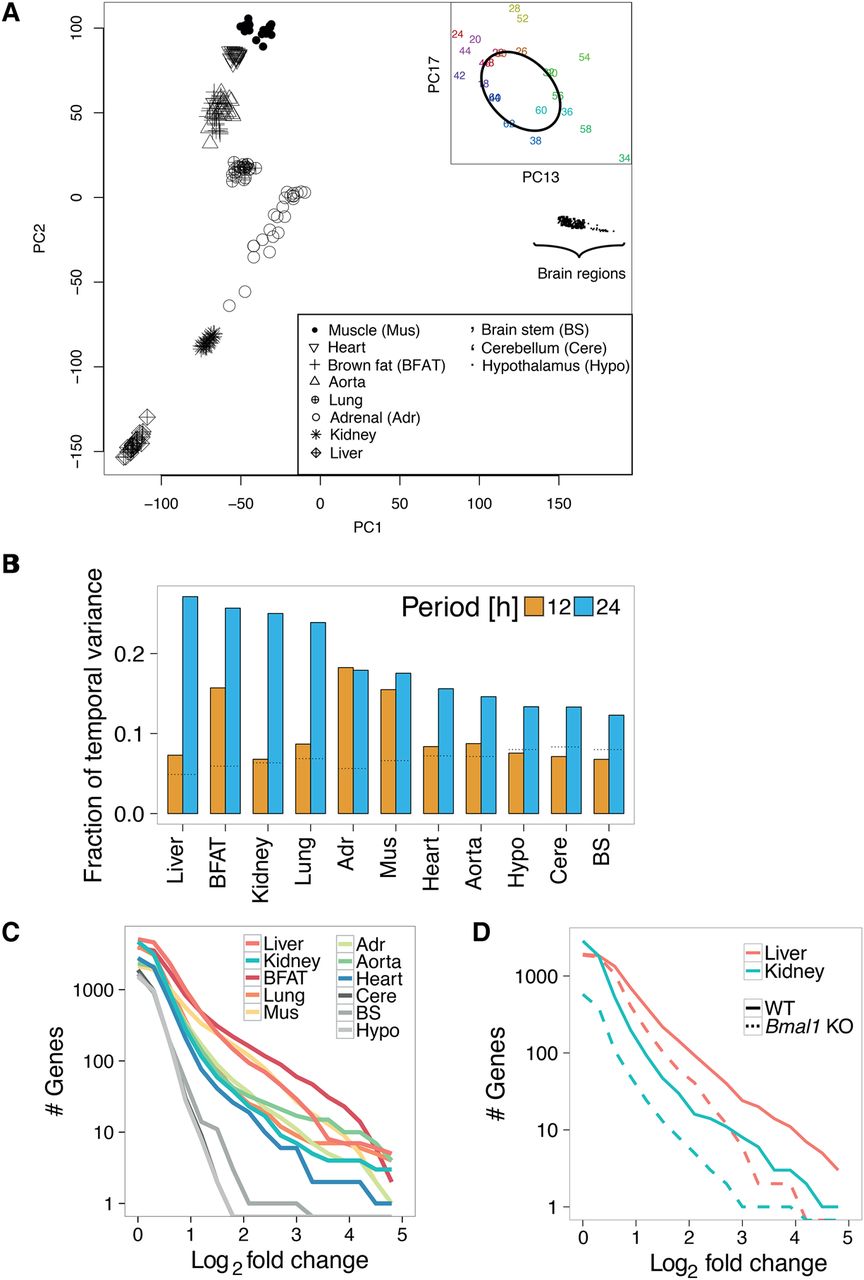
Contribution of tissue, daily time, and circadian clock to global variance in mRNA expression. (A) Principal component analysis (PCA) across 11 WT tissues sampled over 2 d. PC1 and PC2 show clustering of samples by tissues; each point represents a tissue sample (see key) at a specific time point (not labeled). (Inset) Loadings for PC13 and PC17 for the liver samples labeled with circadian time (CT), showing temporal variation along an elliptic path. Labels indicate CT time; samples that are 24 h apart are in the same color. (B) Fractions of temporal variance in each tissue explained by 24- and 12-h periods, obtained by applying spectral analysis genome-wide for each tissue. Dotted horizontal lines represent the expected background level, assuming white noise. (C,D) Cumulative number of rhythmic genes (P < 0.01, harmonic regression) with log2 fold change larger than the value on the x-axis. (C) Analysis on 11 WT tissues. (D) Analysis on four conditions: Bmal1 KO mice and WT littermates in liver and kidney.