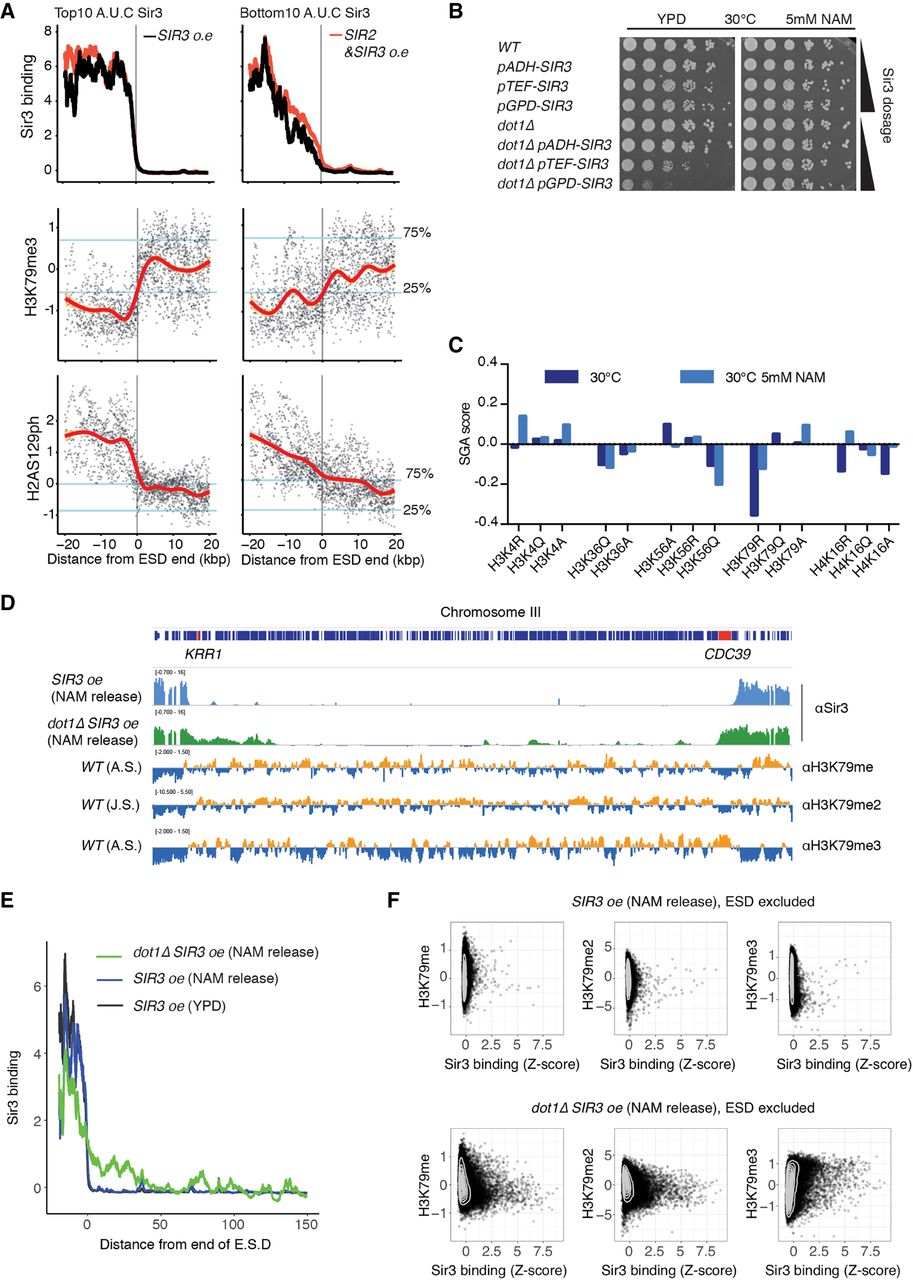
H3K79 methylation is key to sustaining viability upon Sir3 overexpression. (A) Moving average of Sir3 binding at telomeres (10-kb windows, 10-bp step). The top and bottom 10 telomeres with regard to Sir3 signal in strains overexpressing SIR2 and SIR3 were plotted separately. H3K79me3 data were obtained from Weiner et al. (2015). Blue lines indicate genome-wide lower and higher quartiles for each mark. The red line corresponds to the local smoothing of histone modification data. (B) Dilution assay to probe viability of dot1 mutants upon overexpression of SIR3. Cells were constantly grown in the presence of 5 mM NAM prior to this assay. Cells were grown overnight, and 0.5 OD of cells were plated in 5× serial dilutions on YPD or YPD 5 mM NAM. (C) Growth score of selected histone point mutants on galactose plates (Sir3 inducing conditions) with or without NAM compared to glucose plates (Sir3 dosage is WT). (D) Genome browser visualization of Sir3 binding in pGPD-SIR3 and dot1Δ pGPD-SIR3 strains 8 h after being released from 5 mM NAM. KRR1 and CDC39, labeled in red, are essential genes. H3K79 methylation enrichment was obtained from Weiner et al. (2015) for H3K79me and H3K79me3 and from Schulze et al. (2009) for H3K79me2 (Mat score is shown). (E) Moving average of Sir3 binding (block = 1000 bp, window = 10 bp) at the end of ESDs in pGPD-SIR3 and dot1Δ pGPD-SIR3 strains 8 h after being released from 5 mM NAM. (F) Dot plot showing Sir3 enrichment in the indicated strains and condition against the enrichment for each methylation level of H3K79. H3K79 methylation data were obtained from the same source as in D and averaged at each ChIP-chip probe.