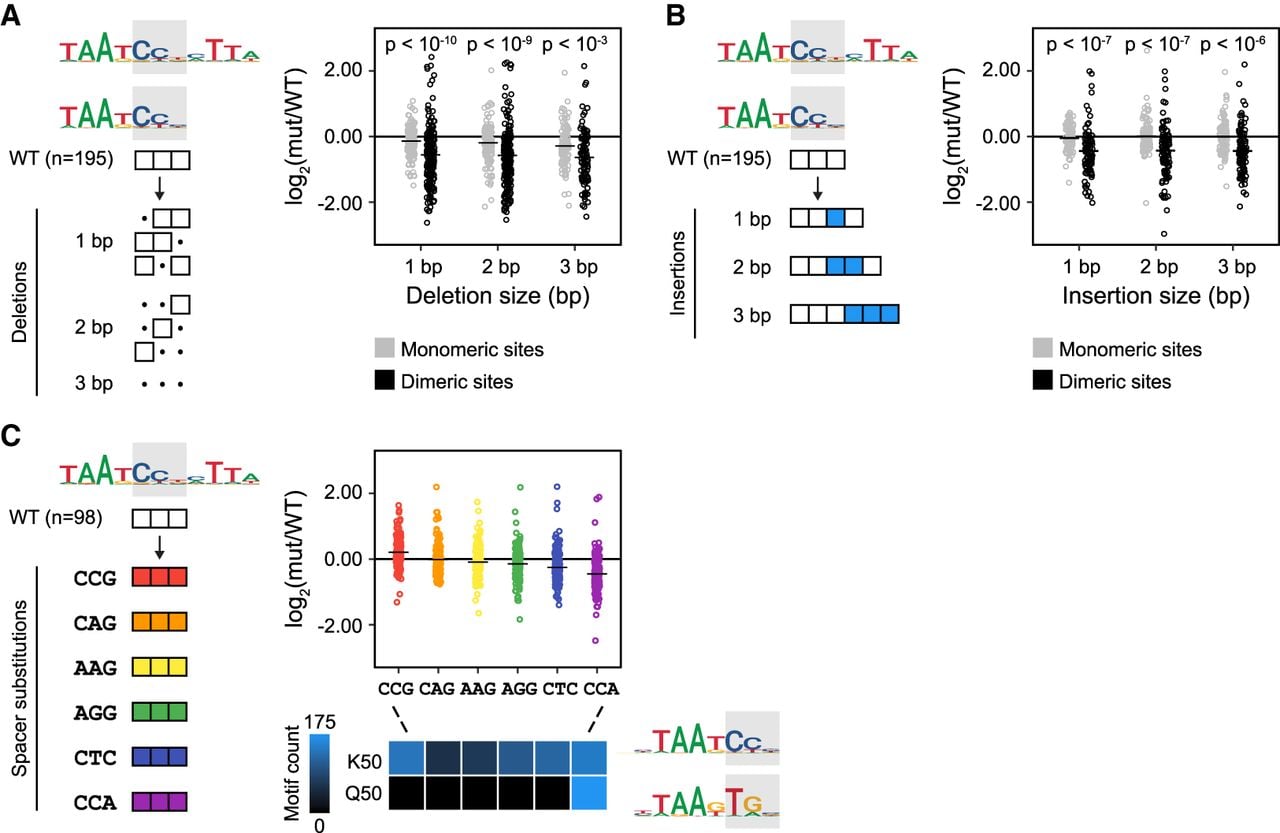
The activity of dimeric CRX binding sites depends on half-site spacing. (A, left) Schematic of experimental approach. The effect of all 1-, 2-, and 3-bp spacer deletions in 195 CRX binding sites were quantified by CRE-seq. (Right) Scatter plot of mutation effects. Points represent individual mutations, and horizontal bars represent the median across all targets for deletions of the indicated size. (B, left) Schematic of experimental approach. The effect of specific 1-, 2-, and 3-bp spacer insertions in 195 CRX binding sites were quantified by CRE-seq. (Right) Scatter plot of mutation effects. Points represent individual mutations, and horizontal bars represent the median across all targets for insertions of the indicated size. In A and B, P-values are reported for Mann-Whitney U tests comparing the distributions of effects between mutations in monomeric versus dimeric CRX binding sites. (C, left) Schematic of experimental approach. The effects of selected 3-bp spacer substitutions in 98 dimeric CRX binding sites were quantified by CRE-seq. (Right) Scatter plot of mutation effects. Points represent individual mutations, and horizontal bars represent the median across all targets for the indicated substitution. The included heatmap shows counts of the indicated K50 and Q50 motifs among binding sites with each spacer substitution.