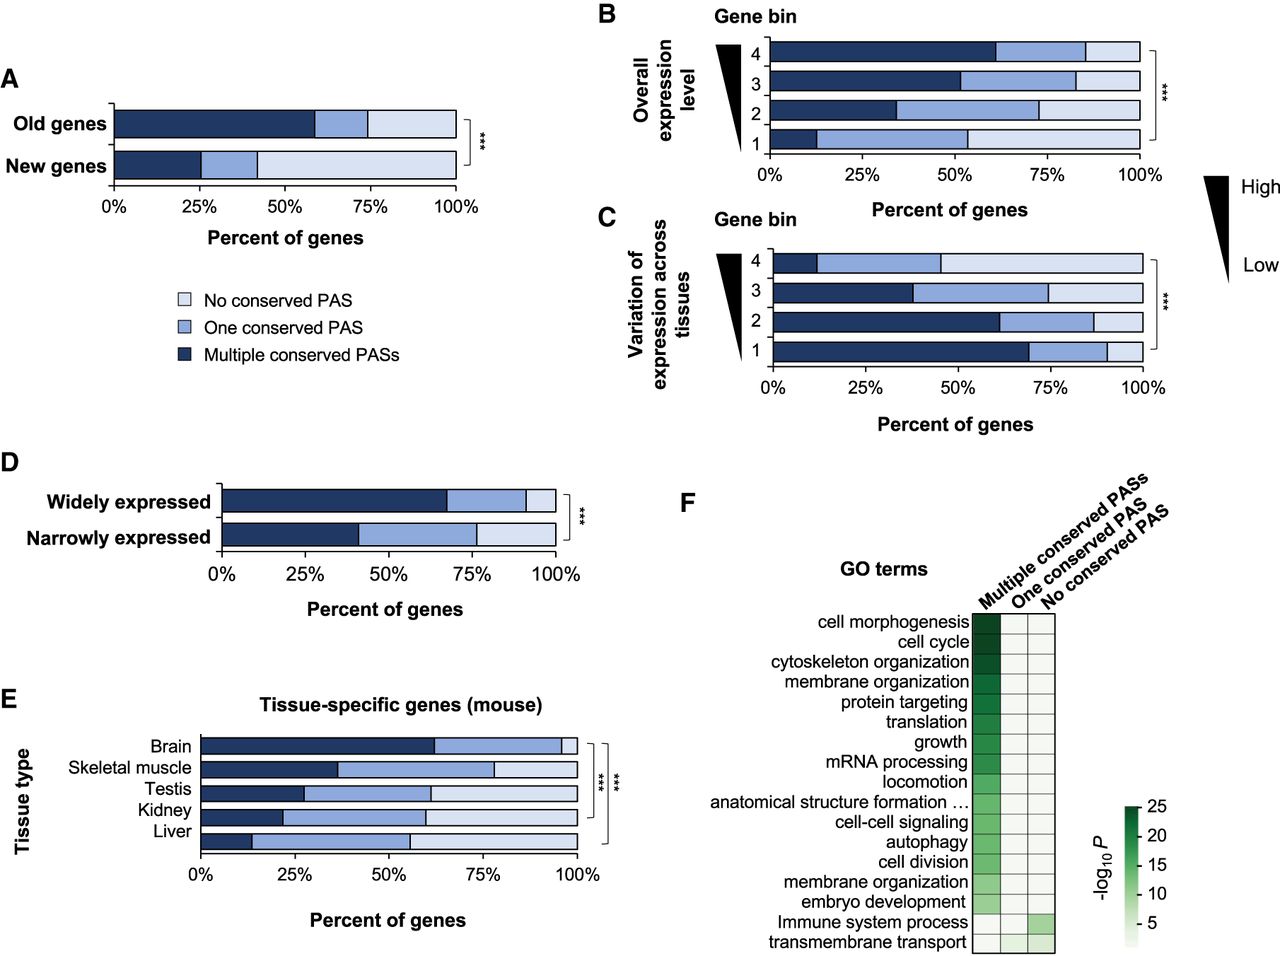
Features associated with mRNA genes with conserved APA. (A) Percentage of genes with conserved PASs in old and new genes. Old genes are mammalian genes with orthologs in zebrafish, and new genes are those without. (B) PAS conservation versus gene expression levels using mouse RNA-seq data. Genes were divided into four groups based on expression levels (average transcripts per million [TPM]) across 22 mouse tissues. (C) PAS conservation versus variation of gene expression levels. Genes were divided into four groups based on the coefficient of variation of expression levels across 22 mouse tissues. (D) PAS conservation versus breadth of gene expression (defined by the PaGenBase database). (E) PAS conservation for genes with tissue-specific expression (defined by the PaGenBase database; only tissues with more than 50 specific genes are shown). (F) Gene Ontology (GO) terms enriched for genes with different types of PAS conservation. P-values are shown in a heatmap using the indicated color scheme. Significance of difference between different groups in A–E are indicated: (***) P < 0.001 (χ2 test). Only mouse data are shown in this figure.