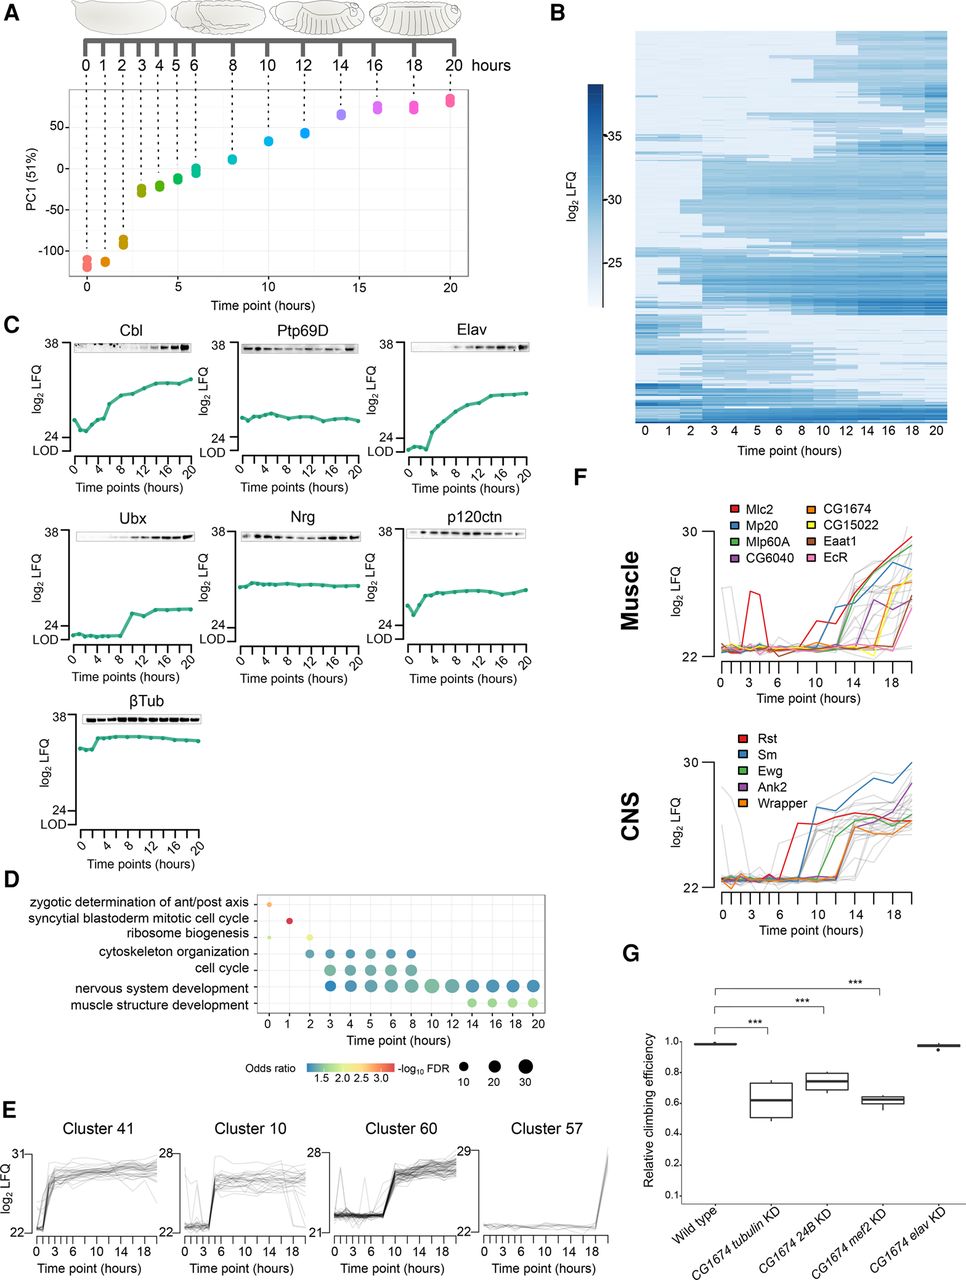
The embryogenesis proteome time course. (A) Scheme indicating the collected time points. PCA shows high reproducibility of replicates, and the first component shows high correlation with developmental progression (R = 0.93). (B) Heat map of log2 LFQ expression values for 1644 developmentally regulated protein groups in embryogenesis. (C) Western blots of seven selected proteins validate their temporal expression profile from the proteomics screen. (D) Dot plot connecting the selected enriched GO terms with developmental progression. The circle size indicates the odds ratio of each GO term category. (E) The regulated protein groups were assigned automatically to 70 clusters based on expression profiles, of which four representative clusters with an up-regulation at 2–3 h (cluster 41), 5 h (cluster 10), 10 h (cluster 60), and 20 h (cluster 57) are shown. (F) Profiles of tissue-specific protein expression created by integrating RNA fluorescence in situ hybridization data. Muscle and central nervous system (CNS) clusters were chosen as examples. (G) Ubiquitous (tubulin-GAL4) and mesodermal (24B- and mef2-GAL4) but not neuronal (elav-GAL4) knockdown of CG1674 results in reduced locomotion activity (Dunnett's test; [***] P-value < 0.001).