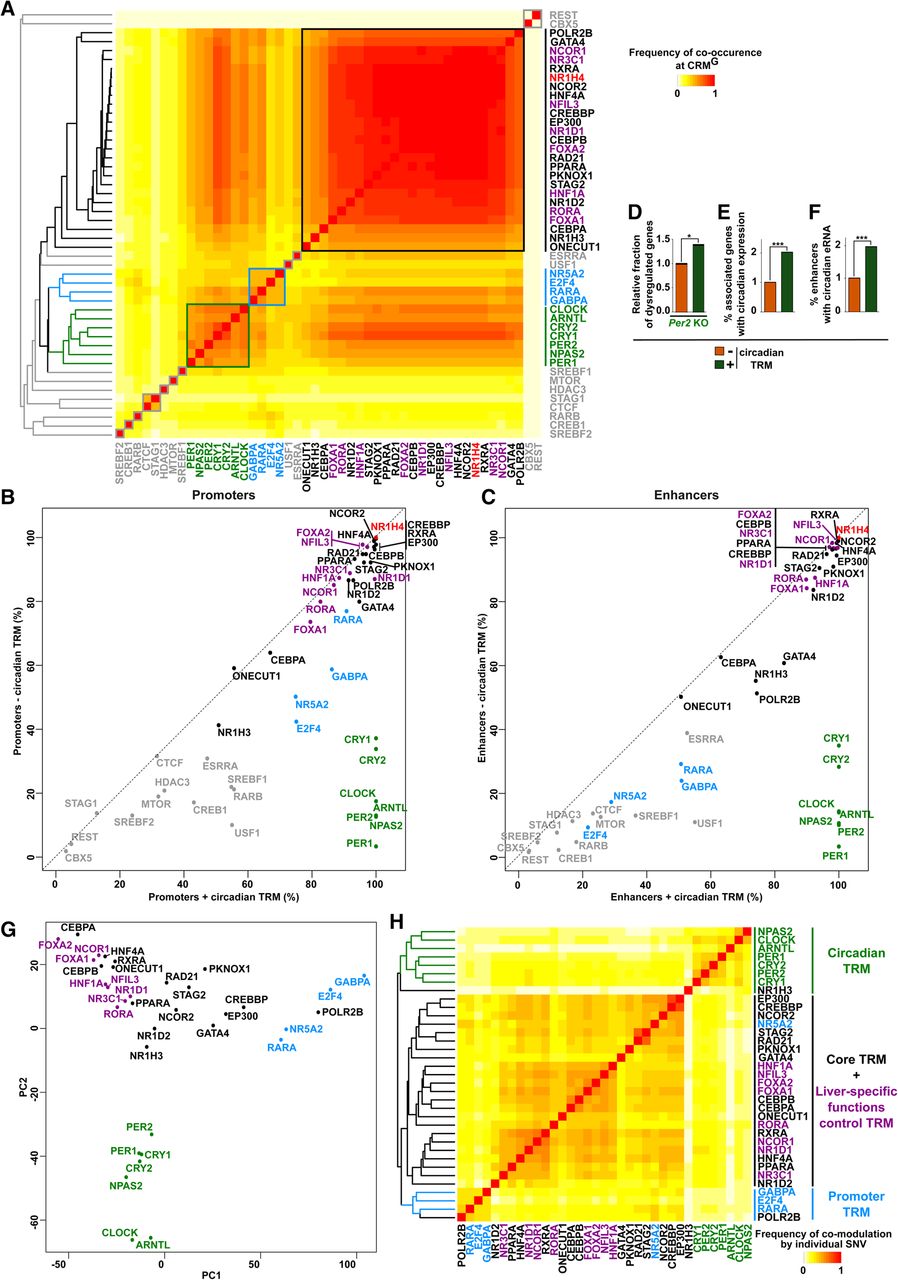
Identification and functional validation of hierarchical combinations of TRMs at NR1H4-bound CRMs. (A) Heat map showing TR co-occurrence at CRMsG defined using a Tanimoto index. TRs were organized based on hierarchical clustering, and main clusters were framed. The hierarchical clustering tree is shown on the left. (B,C) Plots showing the occurrence of each TR at CRMG promoters (B) or enhancers (C) characterized by the presence of 0–2 (− circadian TRMs) or all seven core circadian TRs (+ circadian TRMs). (D) Analyses were performed as in Figure 4D using transcriptomic data from the liver of Per2 KO mice. (E) The fraction of genes exclusively associated with CRMG −/+ circadian TRMs displaying circadian expression in the mouse liver was defined using genes with circadian transcription identified using global run-on sequencing (GRO-seq) (Fang et al. 2014). Fisher's exact test was used to define statistically significant differences between CRMG −/+ circadian TRMs; (***) P < 0.001. (F) The fraction of CRMG enhancers −/+ circadian TRMs displaying circadian eRNA transcription in the mouse liver was defined using data from Fang et al. (2014). Fisher's exact test was used to define statistically significant differences between CRMG enhancers −/+ circadian TRMs; (***) P < 0.001. (G) The IGR tool was used to predict the impact of 63,968 SNVs on binding to CRMsG of the indicated TRs, and data were then mined using PCA. Fold change was set to 0 when the modulatory effect of a SNV did not reach statistical significance (Benjamini–Hochberg corrected P-value > 0.05) or when it relates to weak TR binding (i.e., binding not called by MACS2 in our previous analyses). (H) The IGR tool was used to predict the impact of SNVs localized within CRMsG on chromatin binding of the indicated TRs, and pairwise comparisons were subsequently performed. Only SNVs localized within CRMsG corecruiting the two TRs and significantly modulating the binding of one of these two TRs (Benjamini–Hochberg corrected P-value < 0.05) were considered. The frequency of comodulation by individual SNPs was calculated using a Tanimoto index. The hierarchical clustering tree is shown on the left.